

DESIGN THEORY
UNITING DESIGN AND ART FOR CHANGE AND JUSTICE
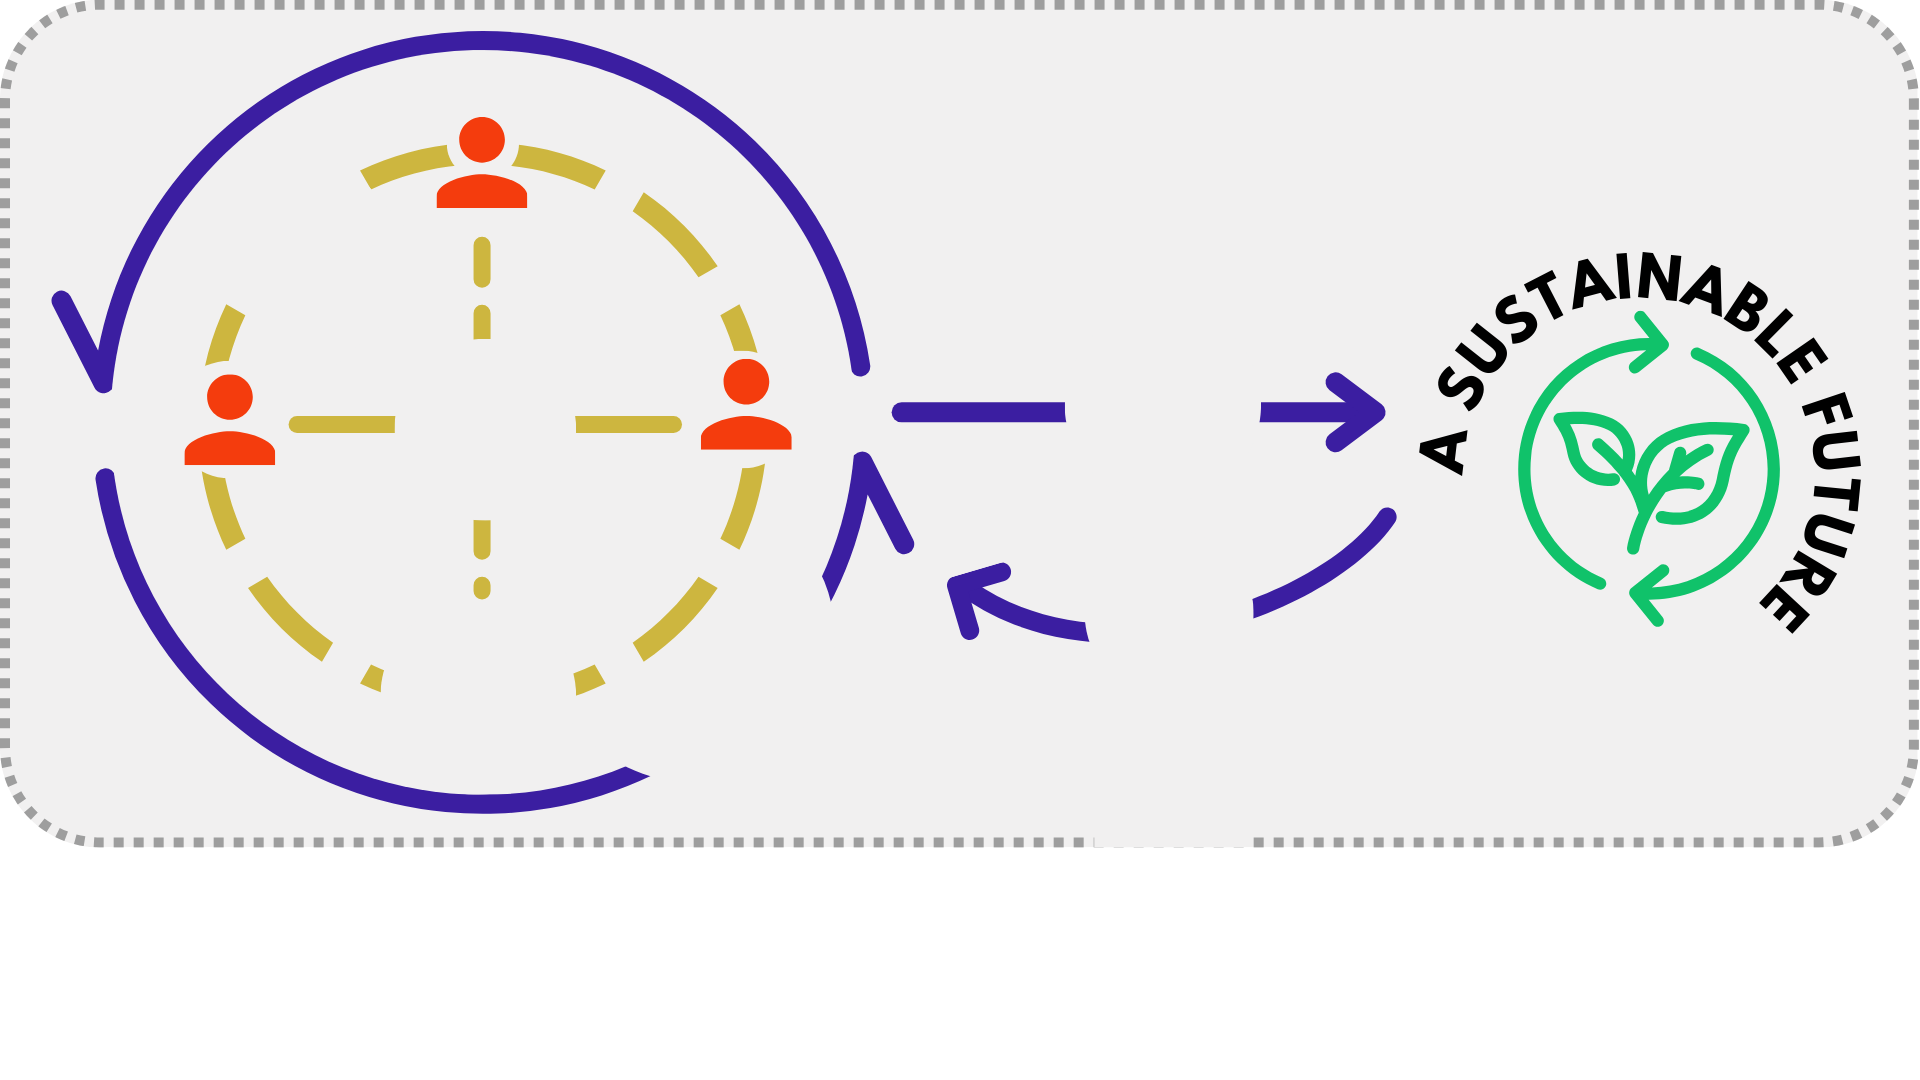
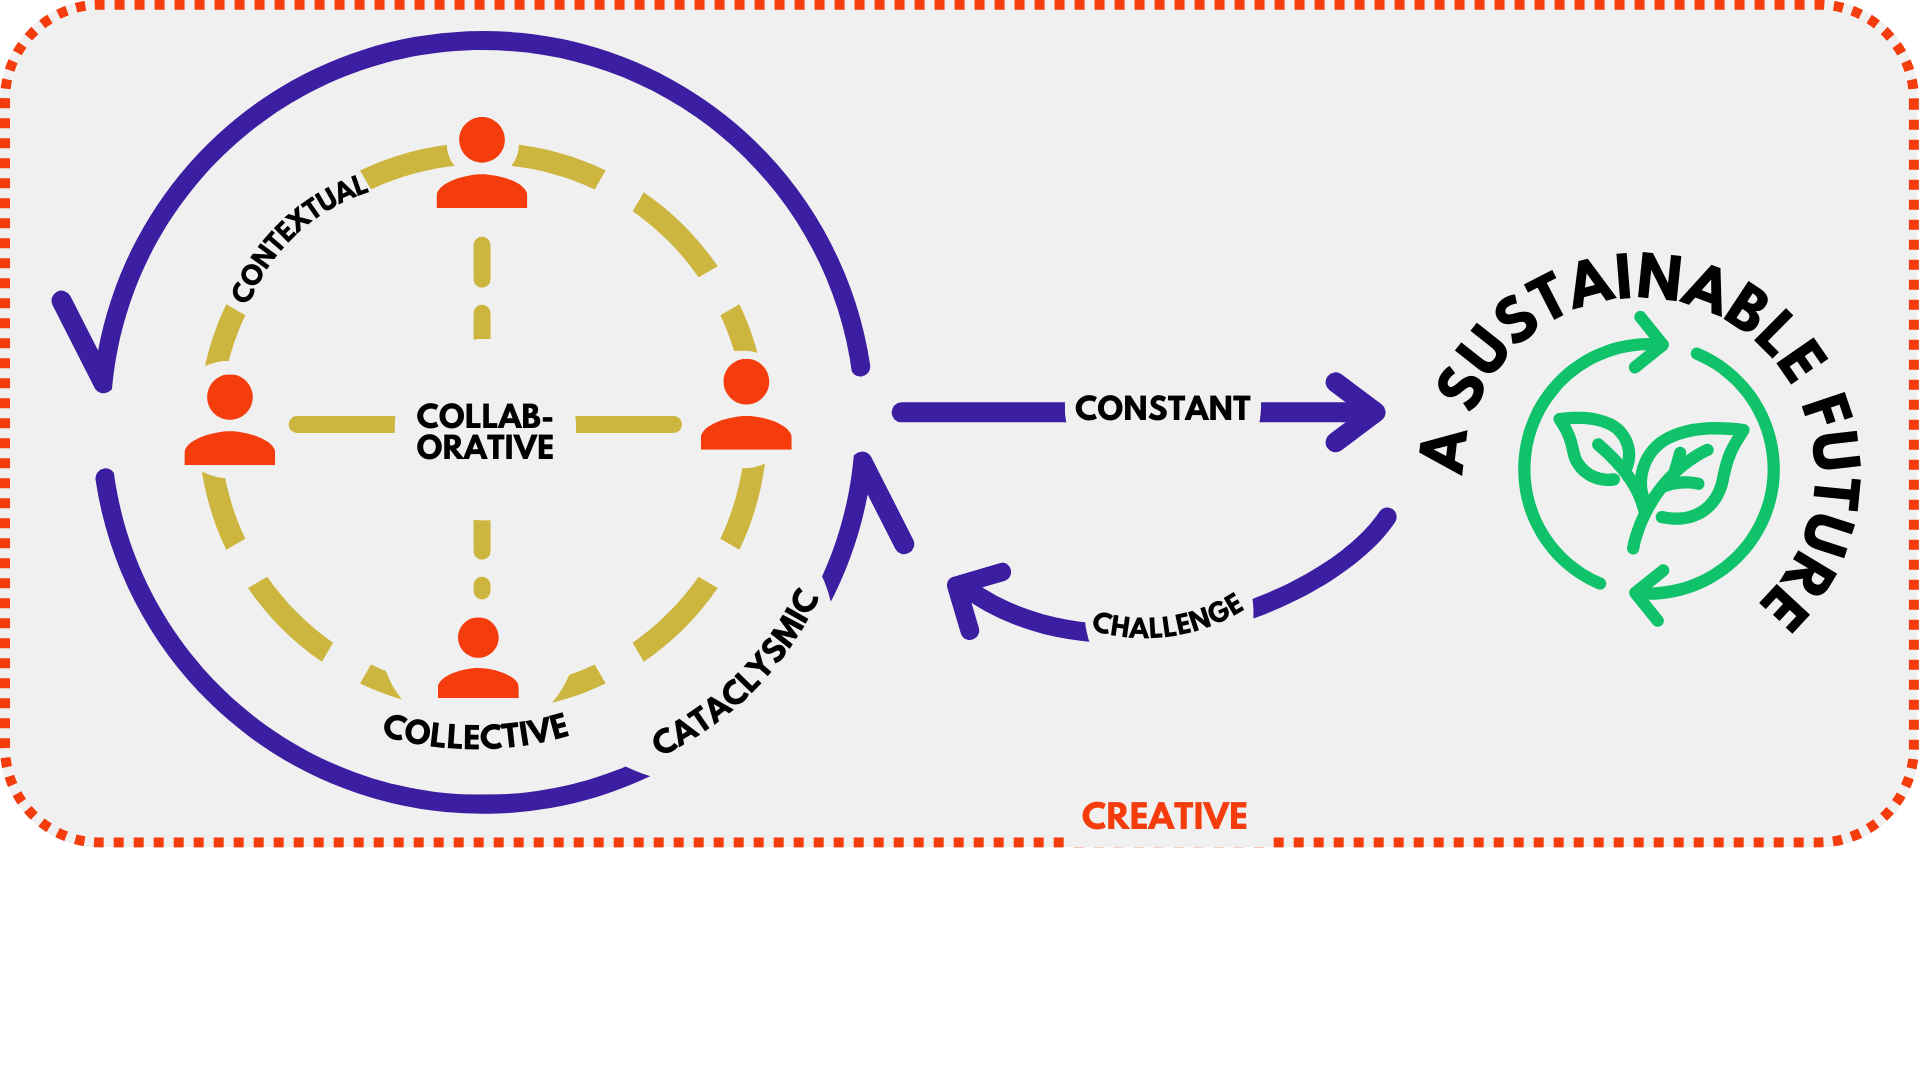
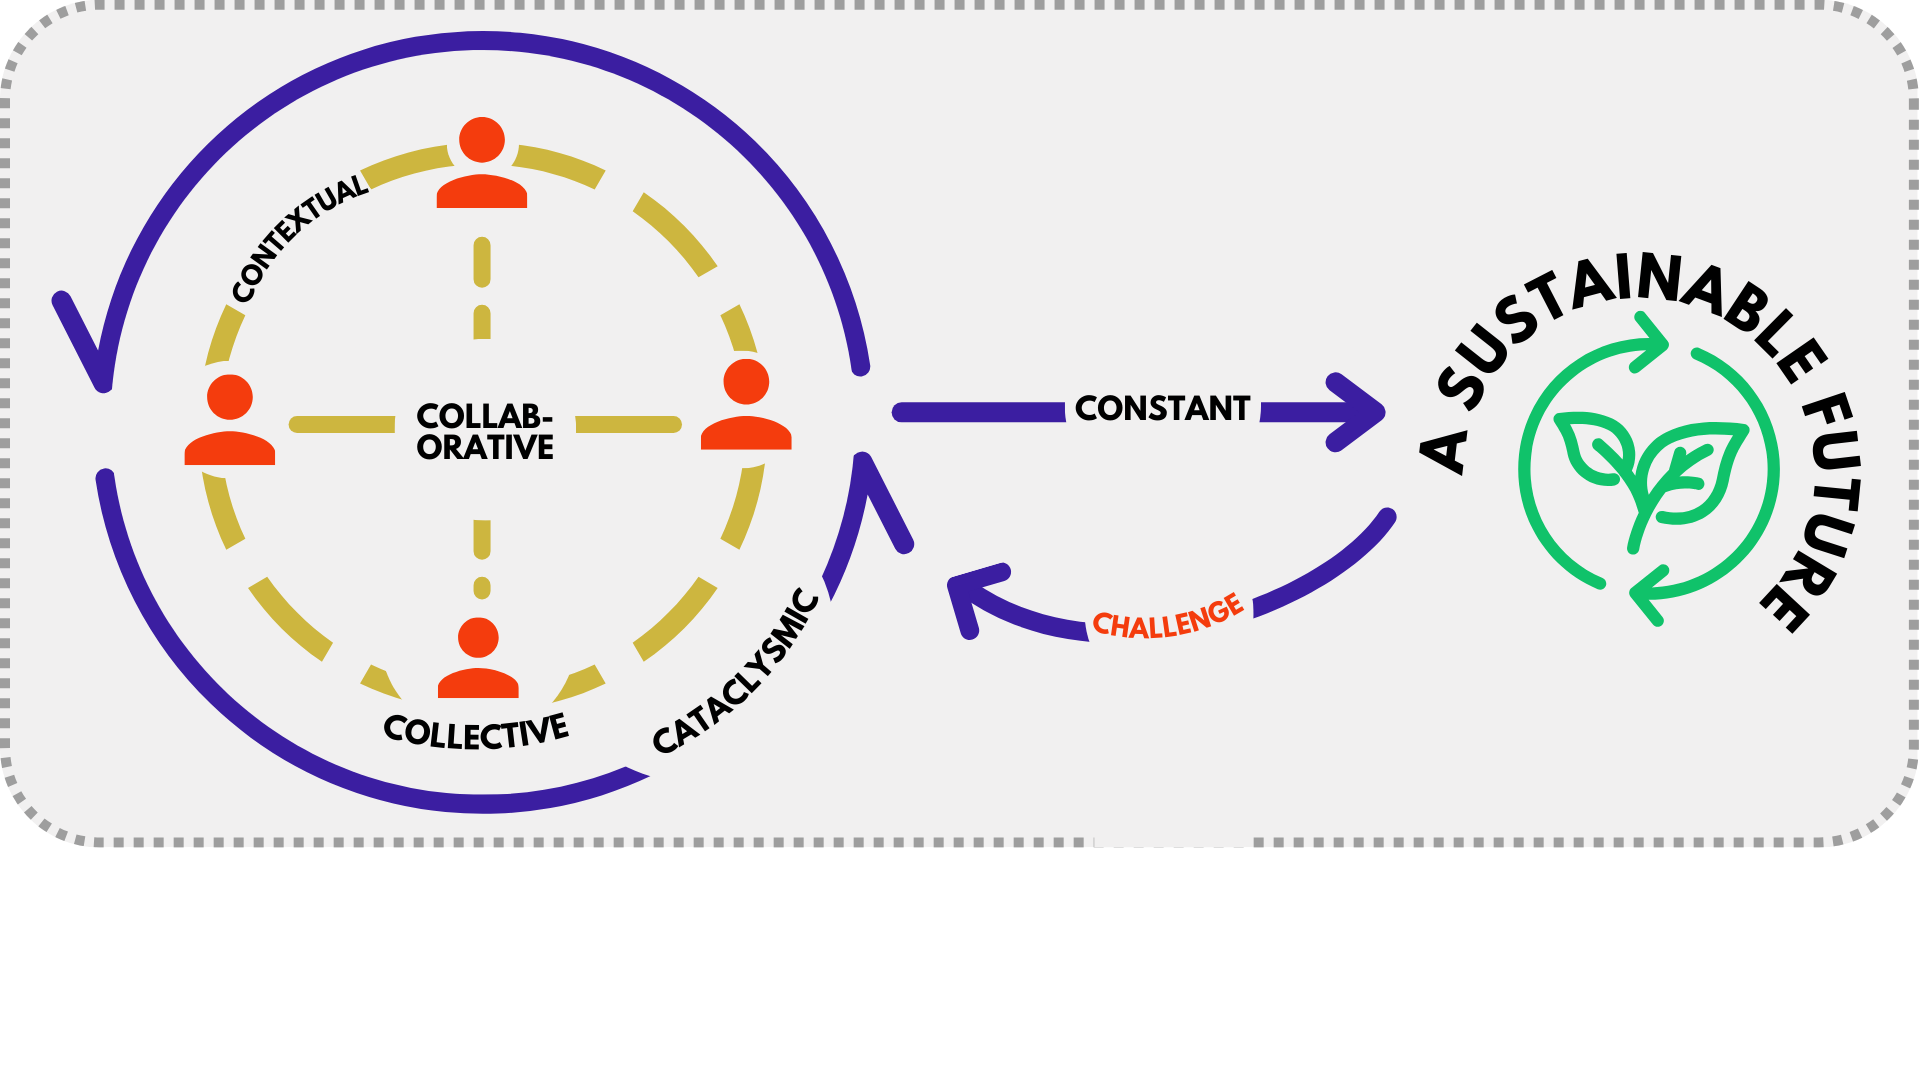
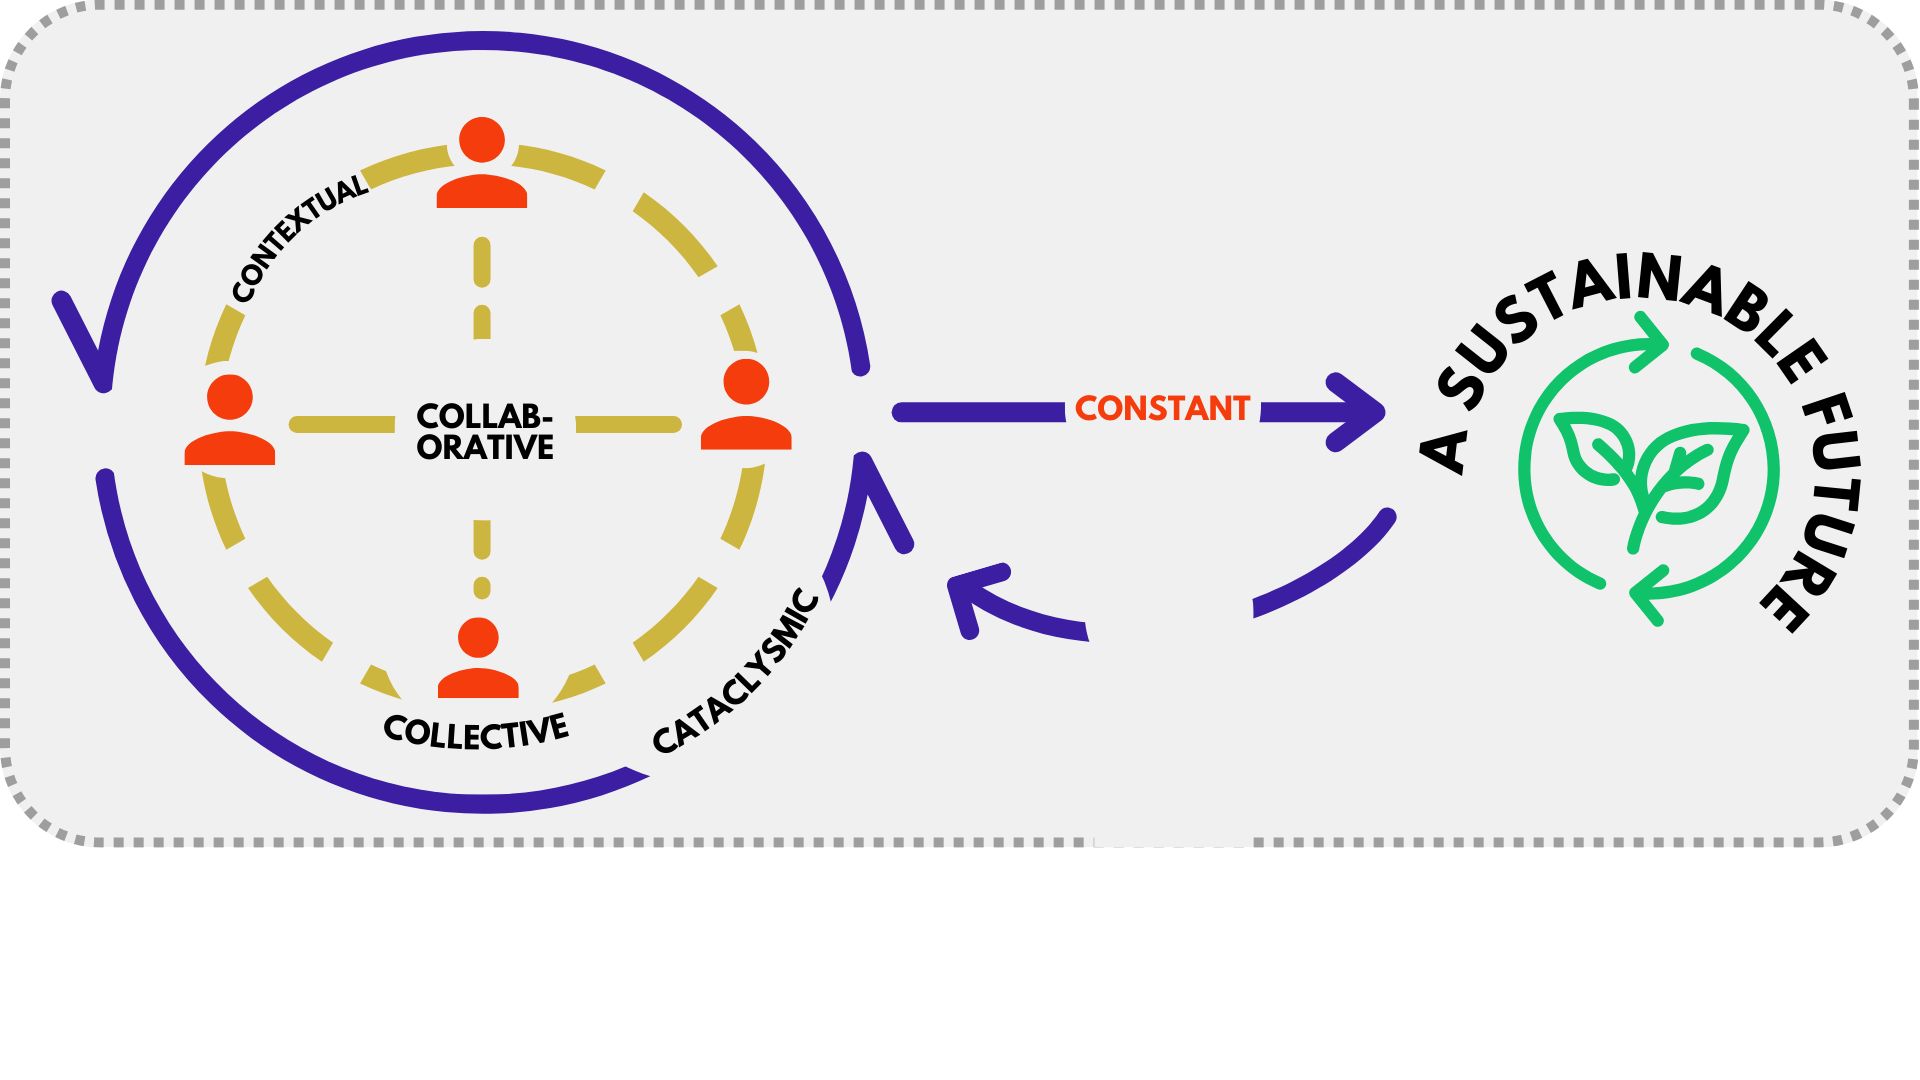
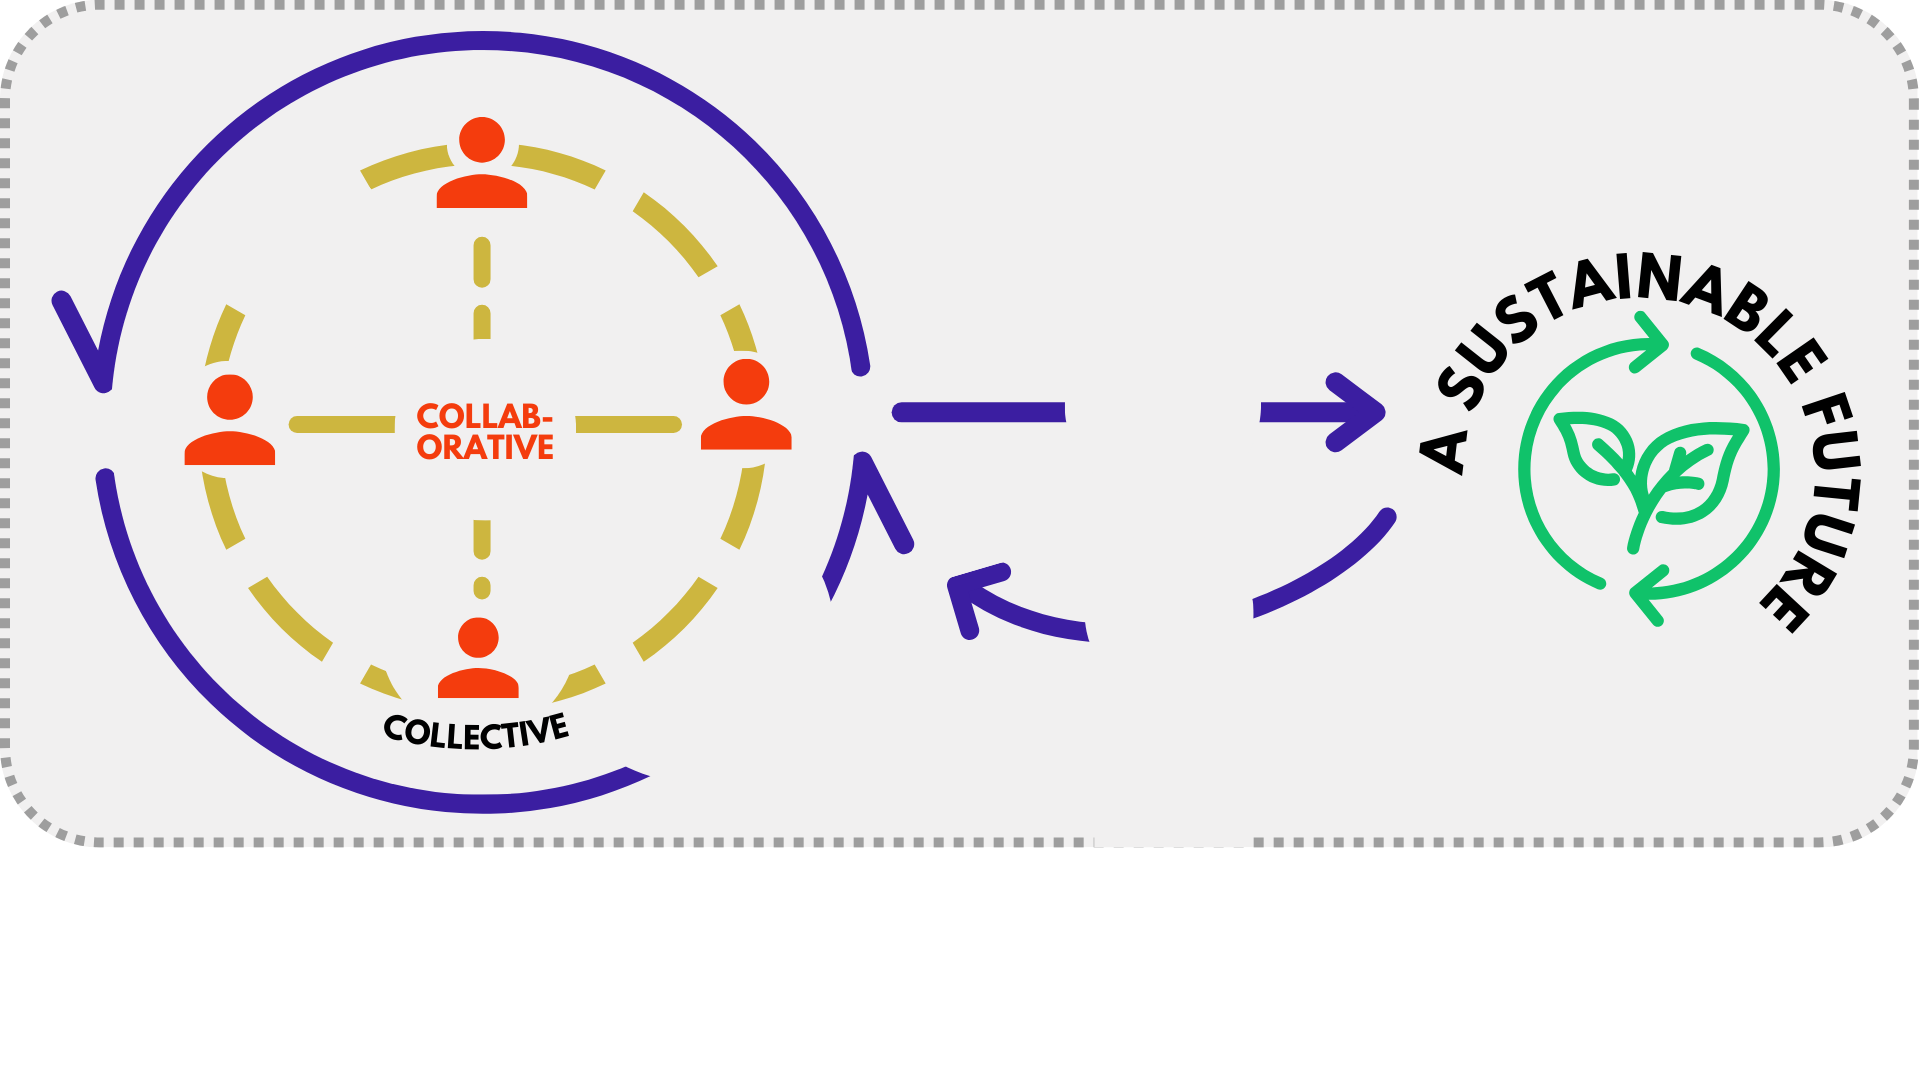
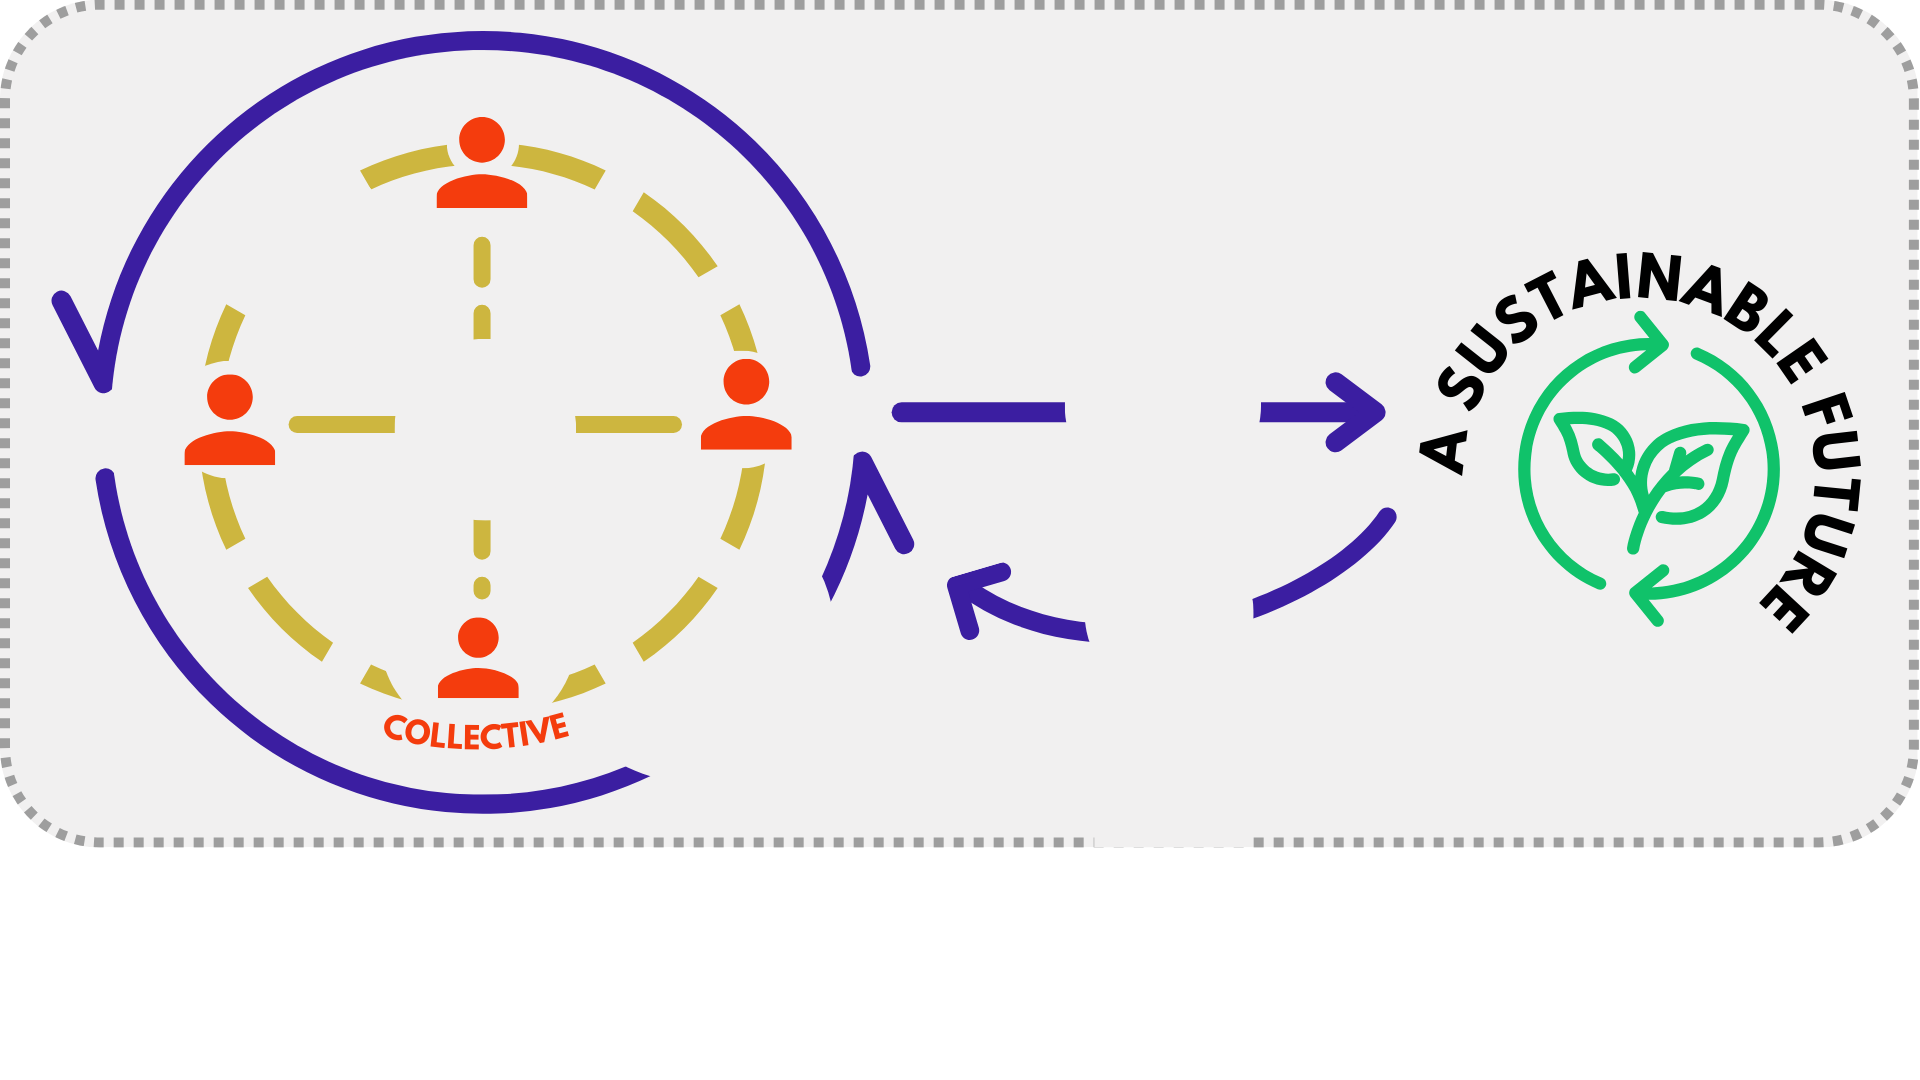
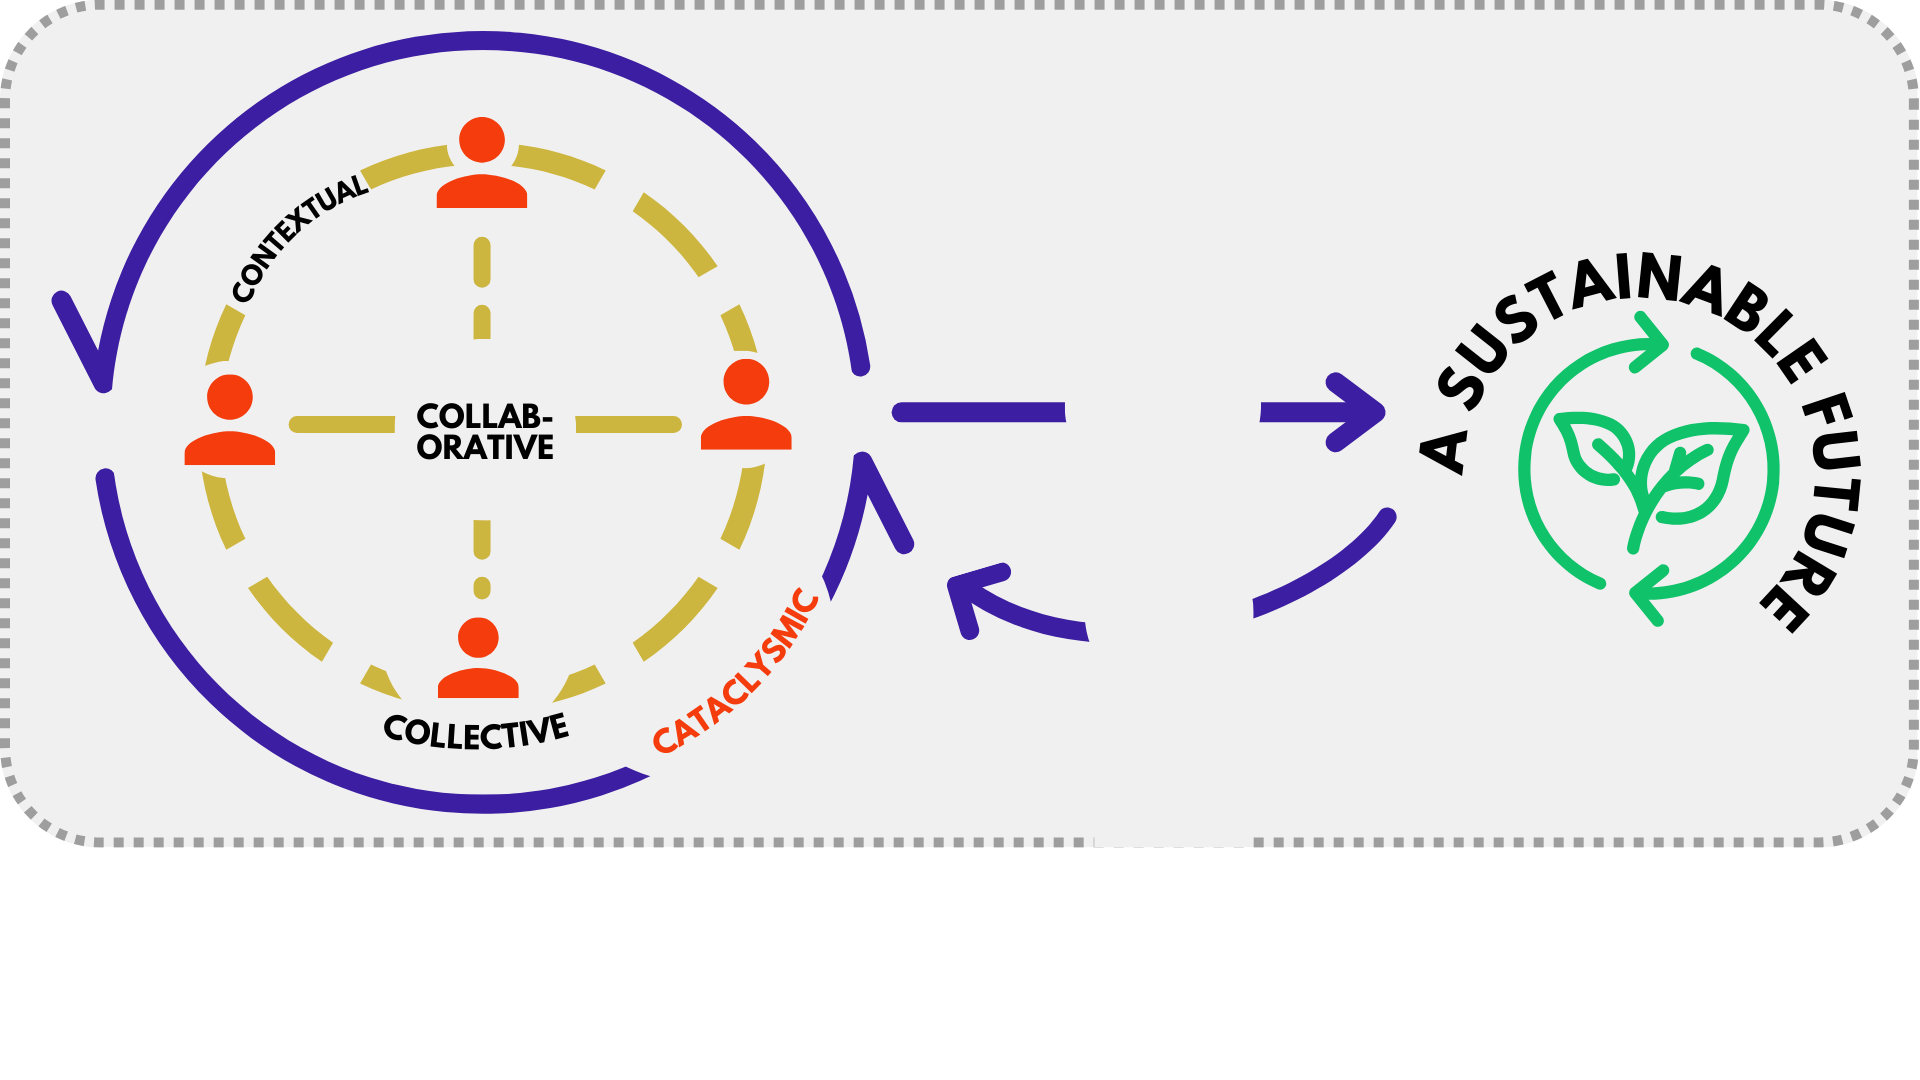
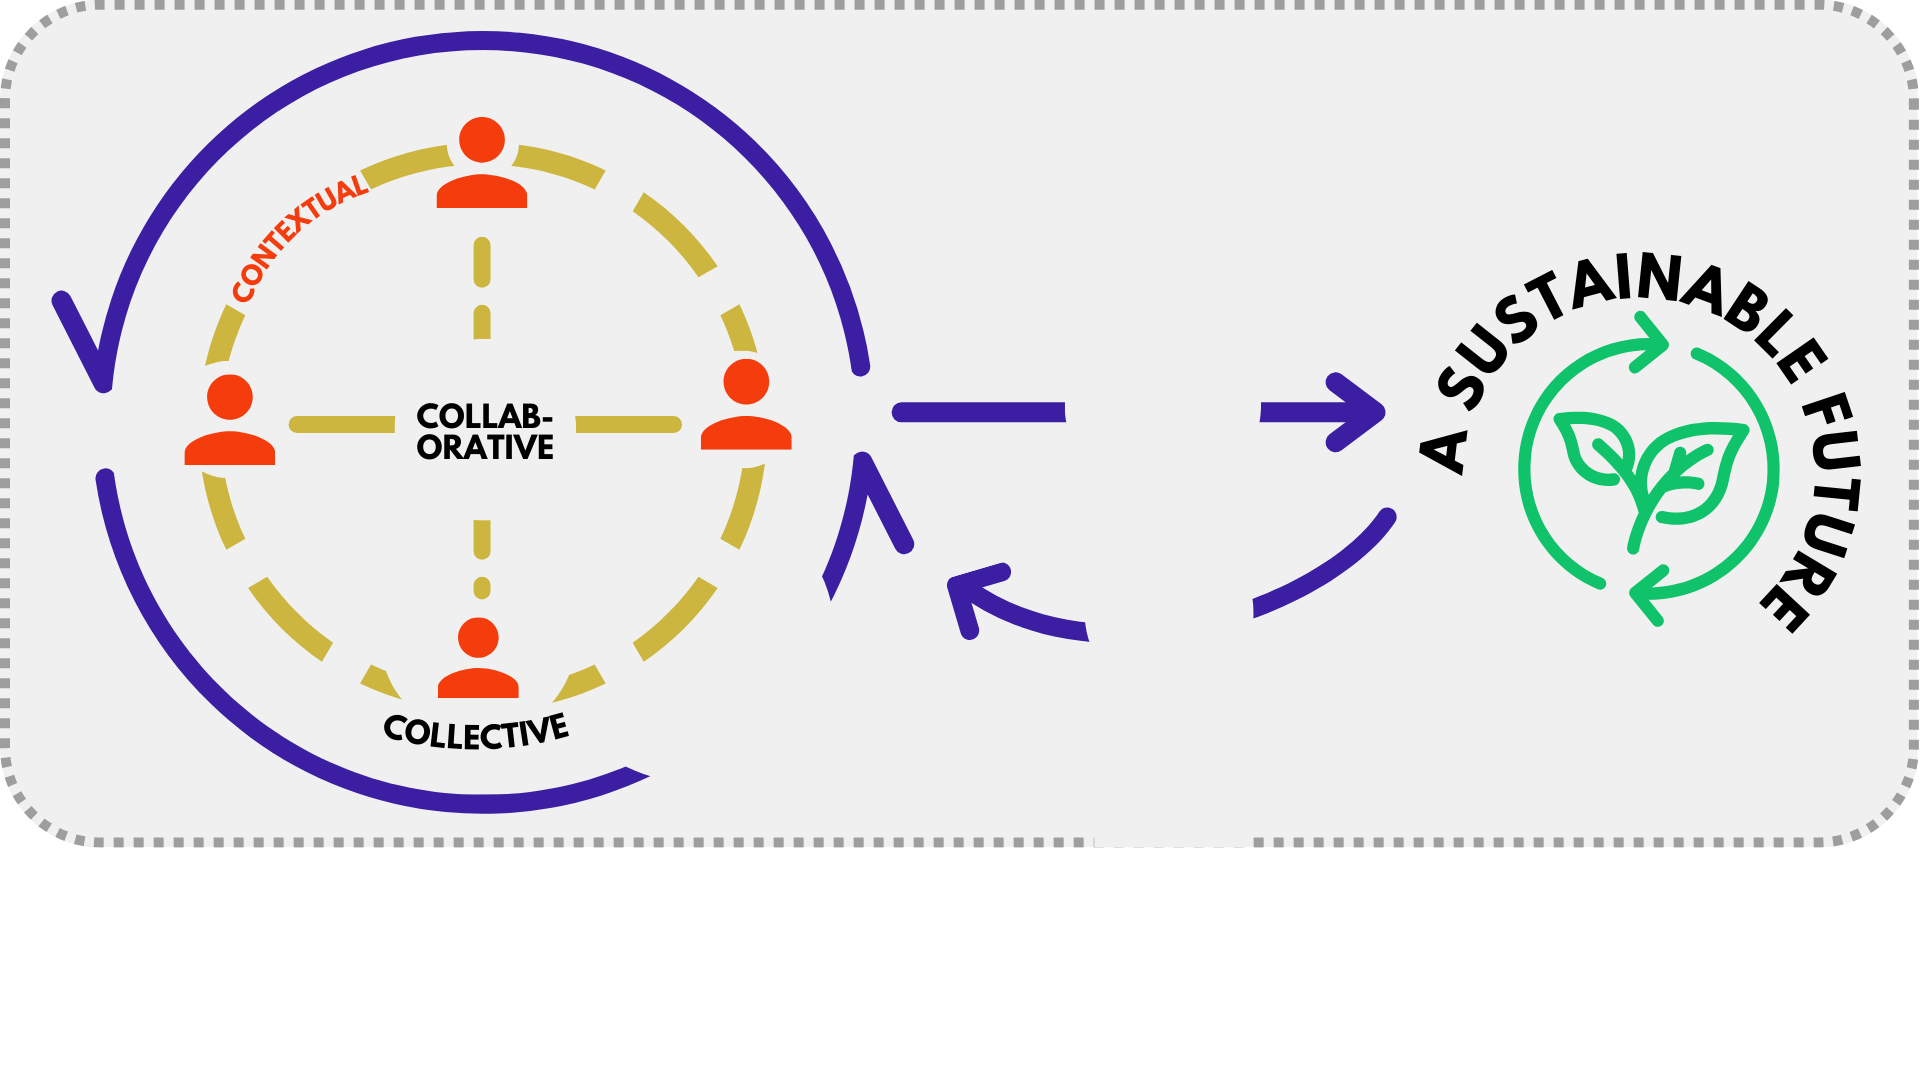
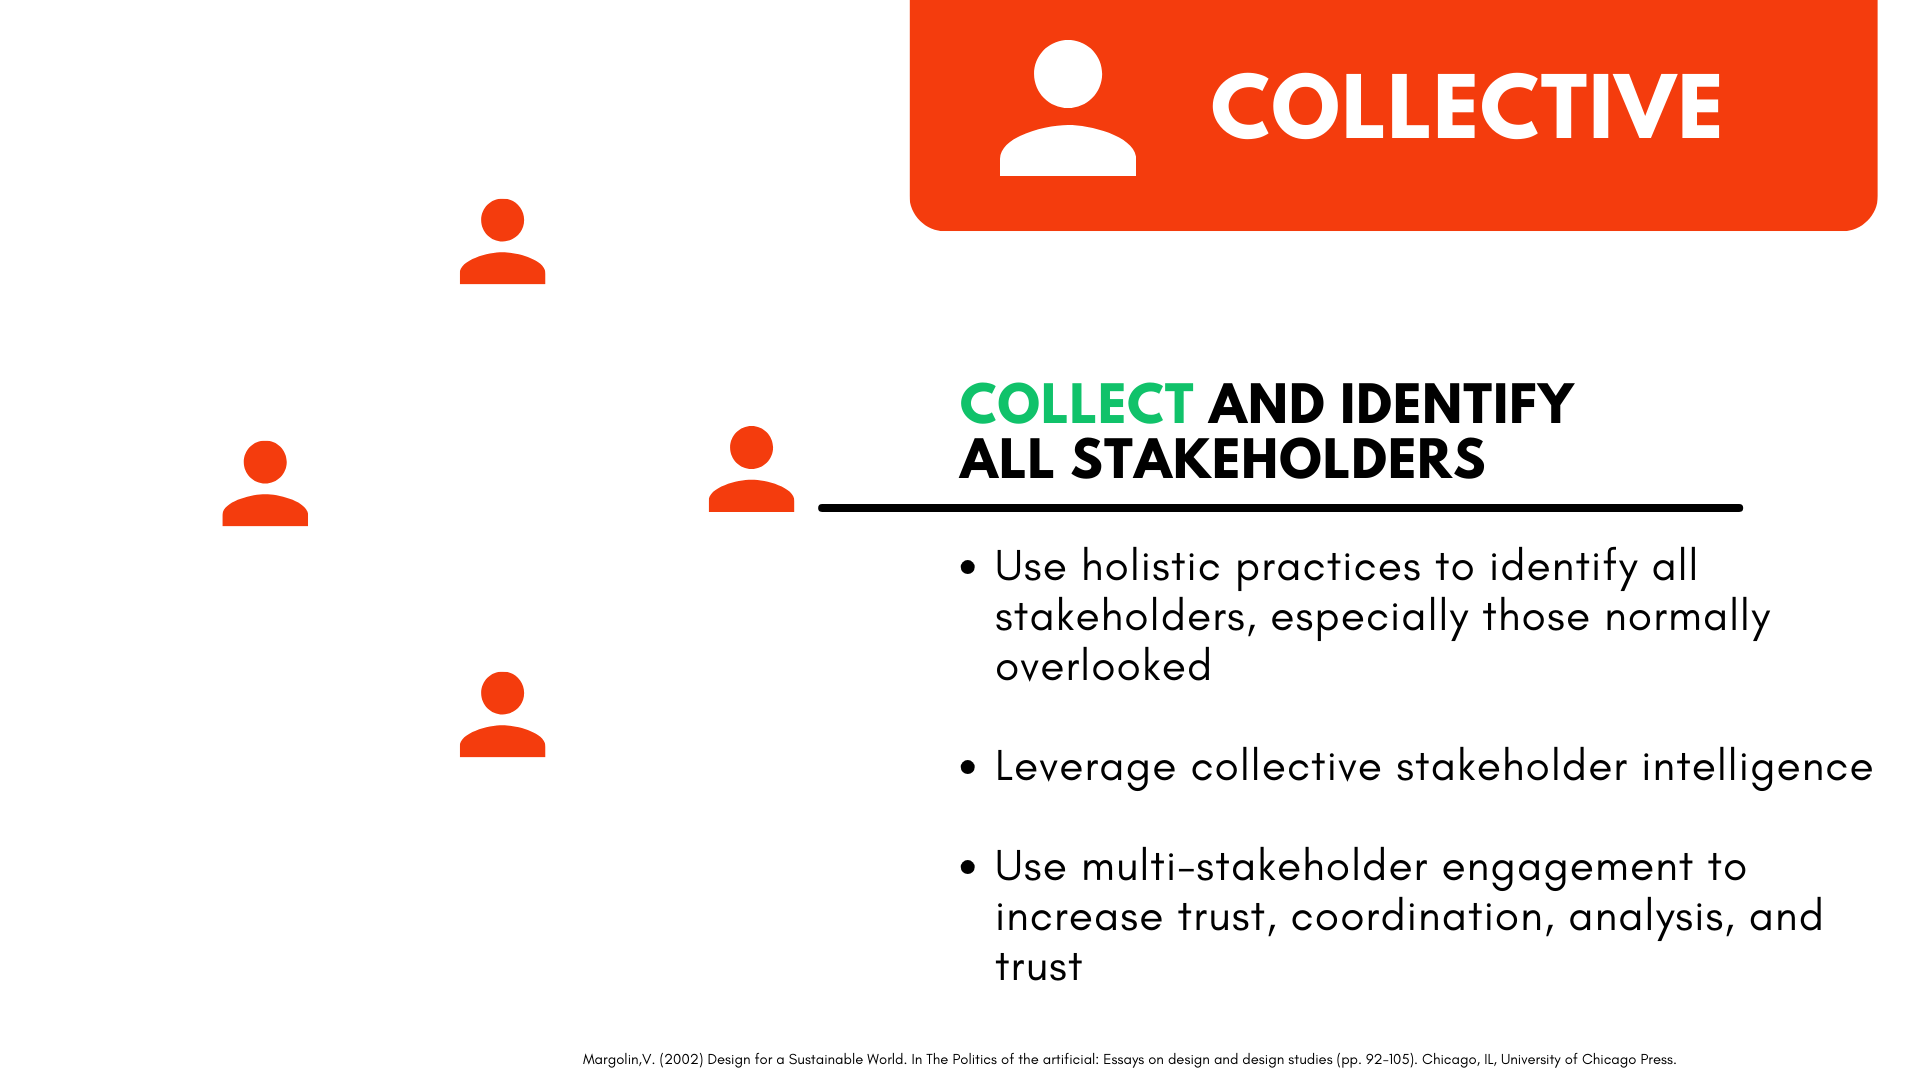
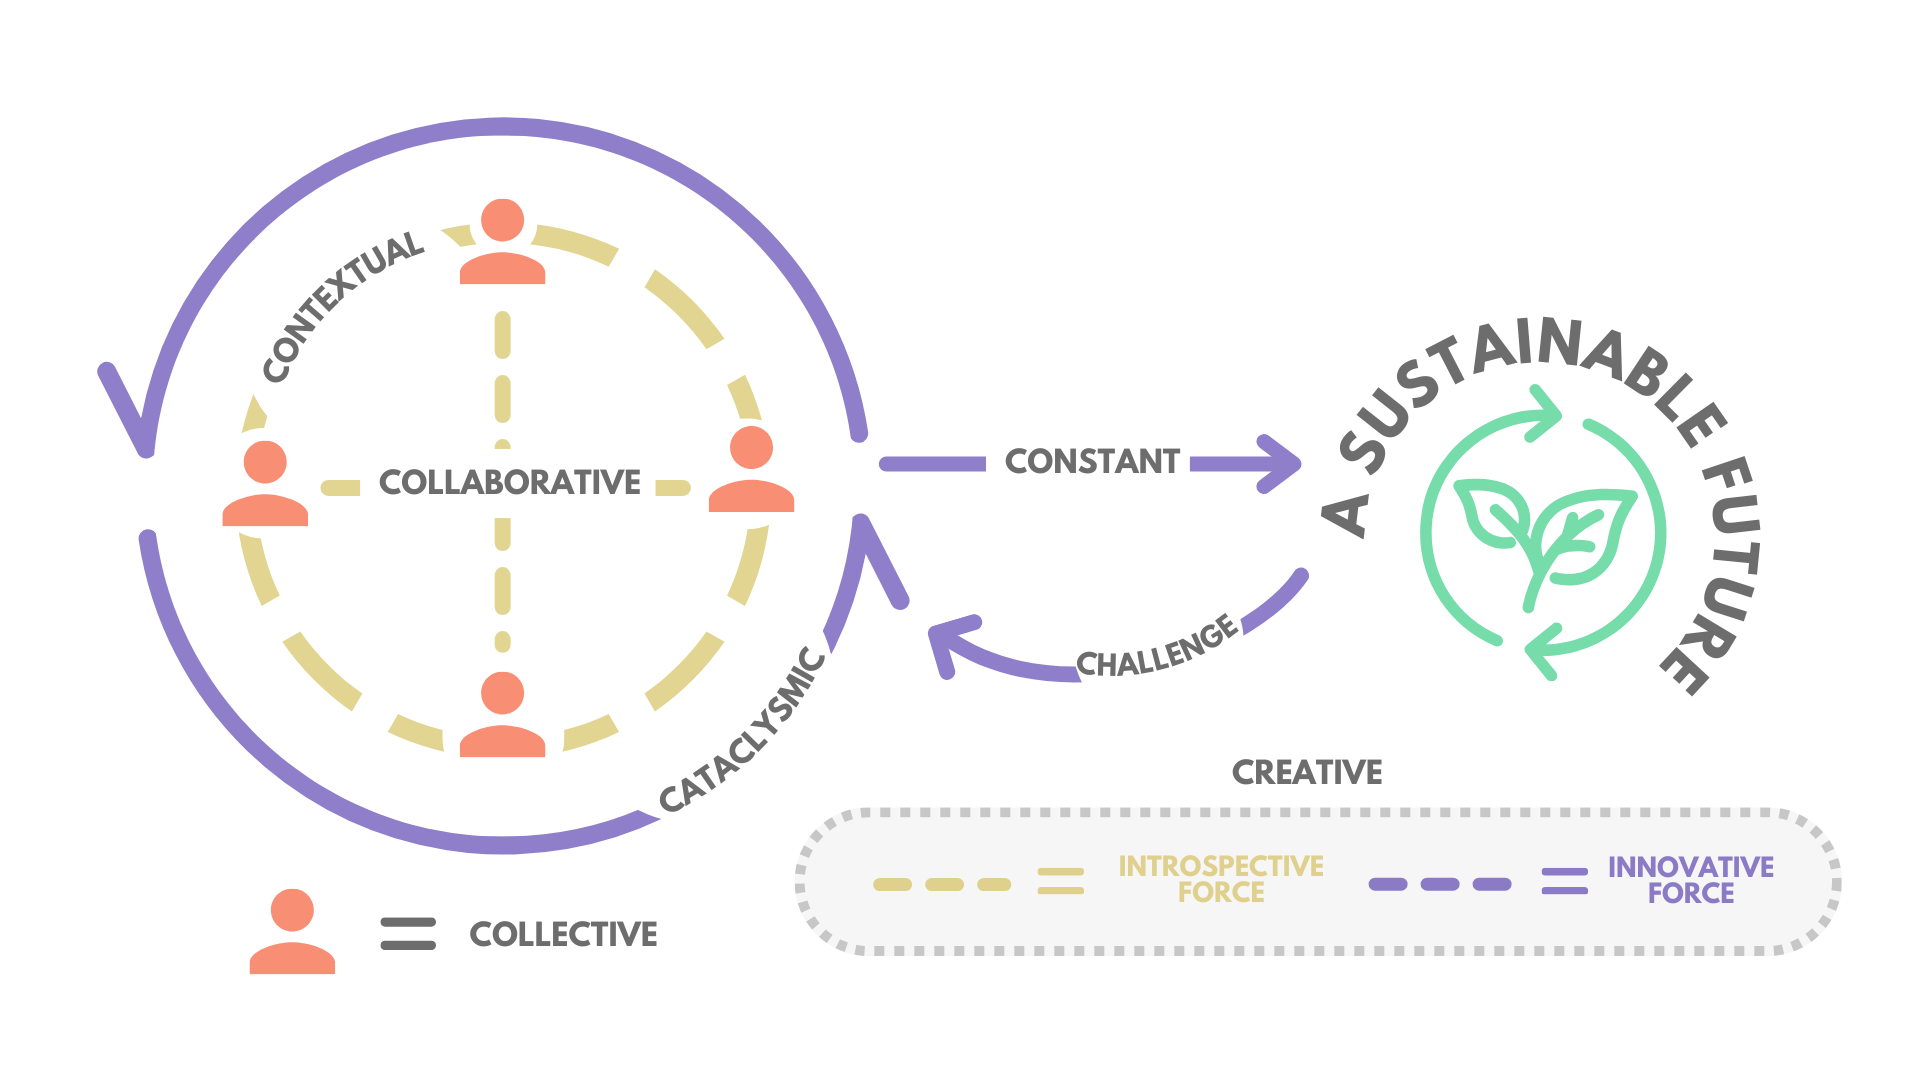
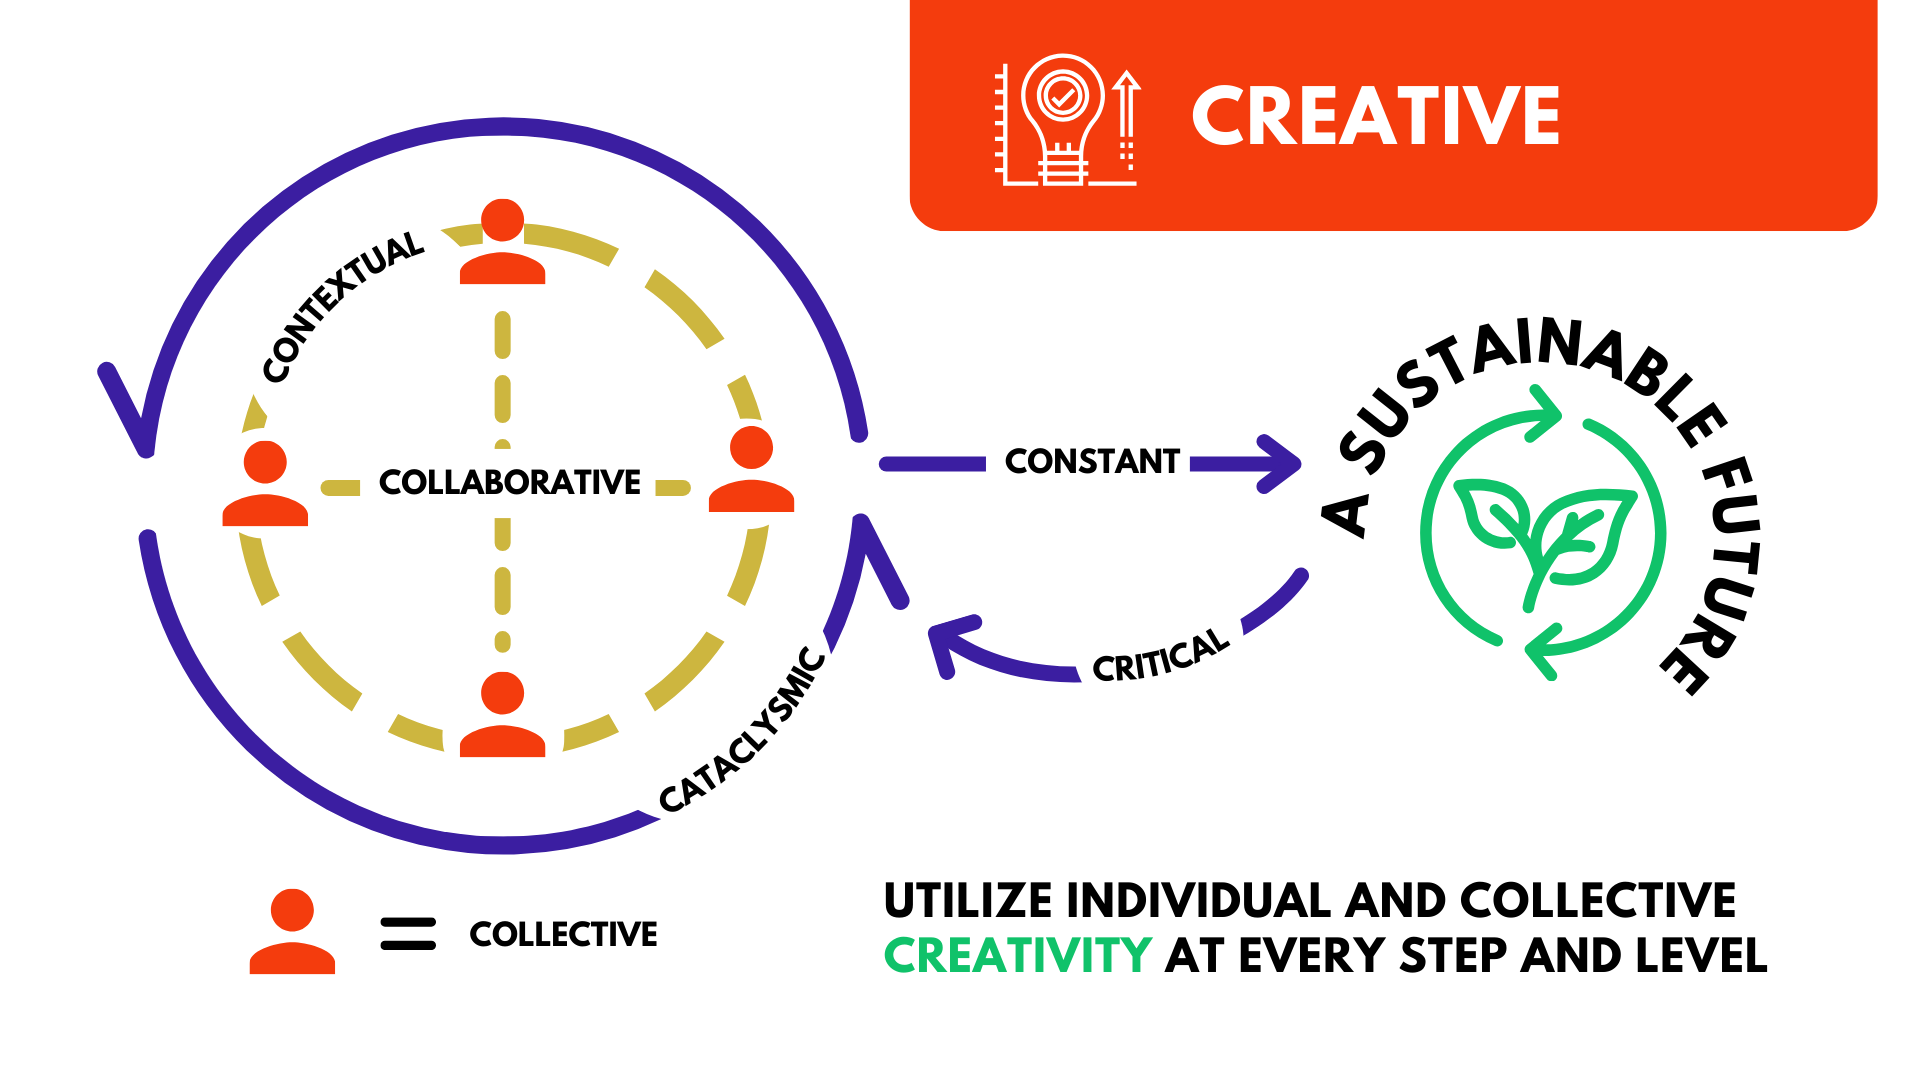
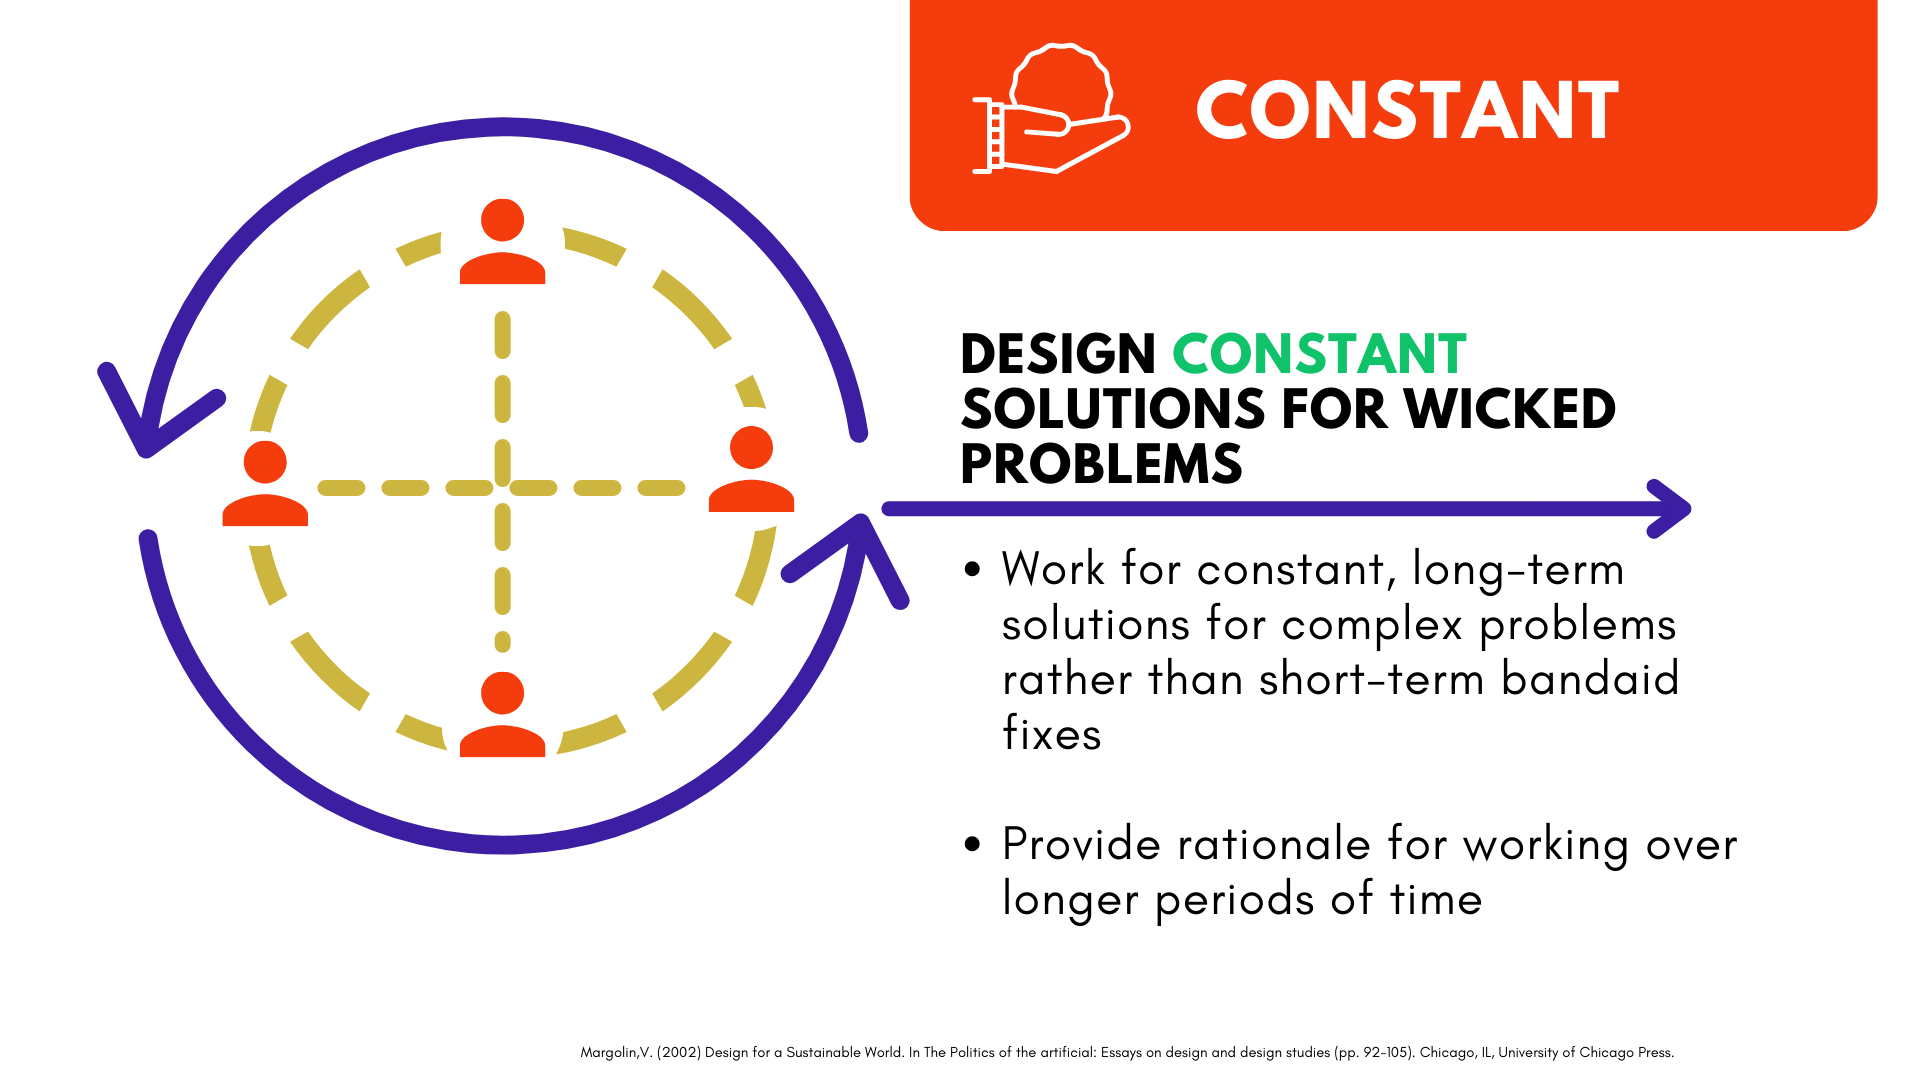
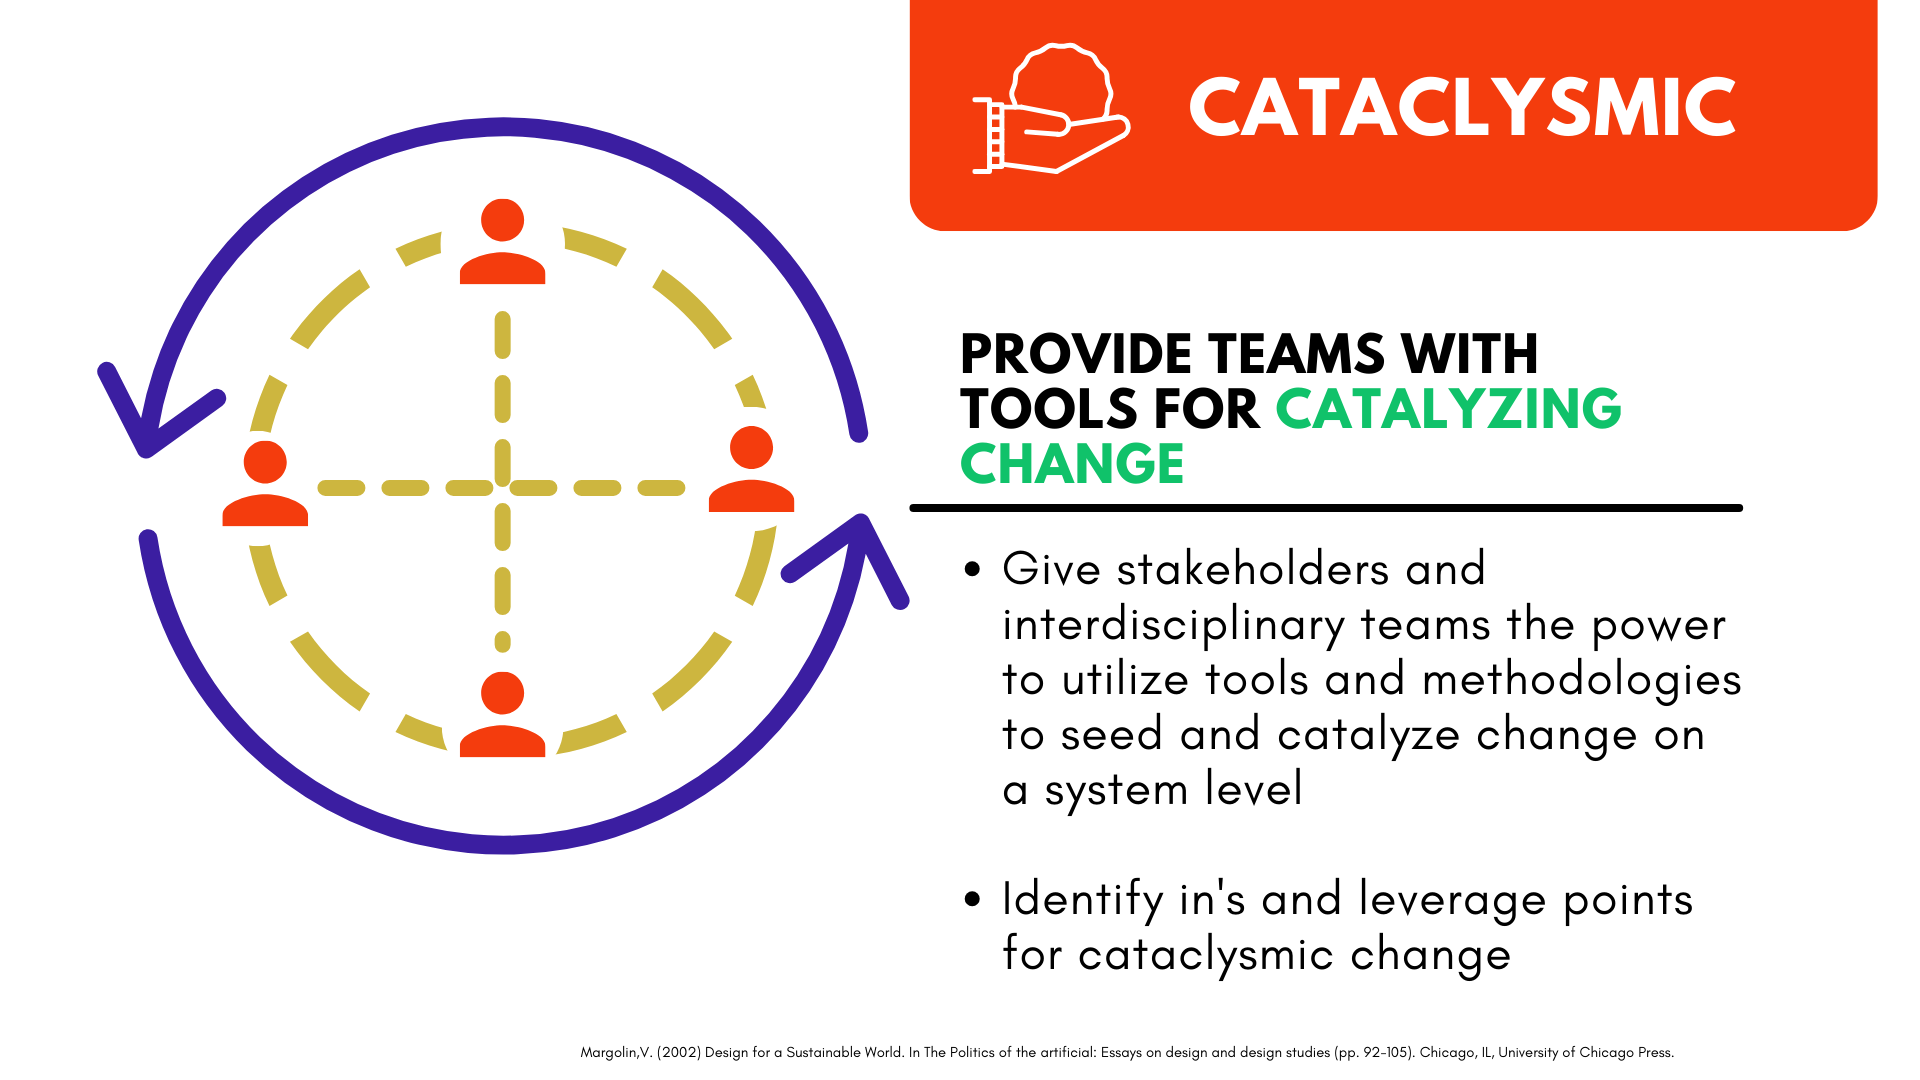
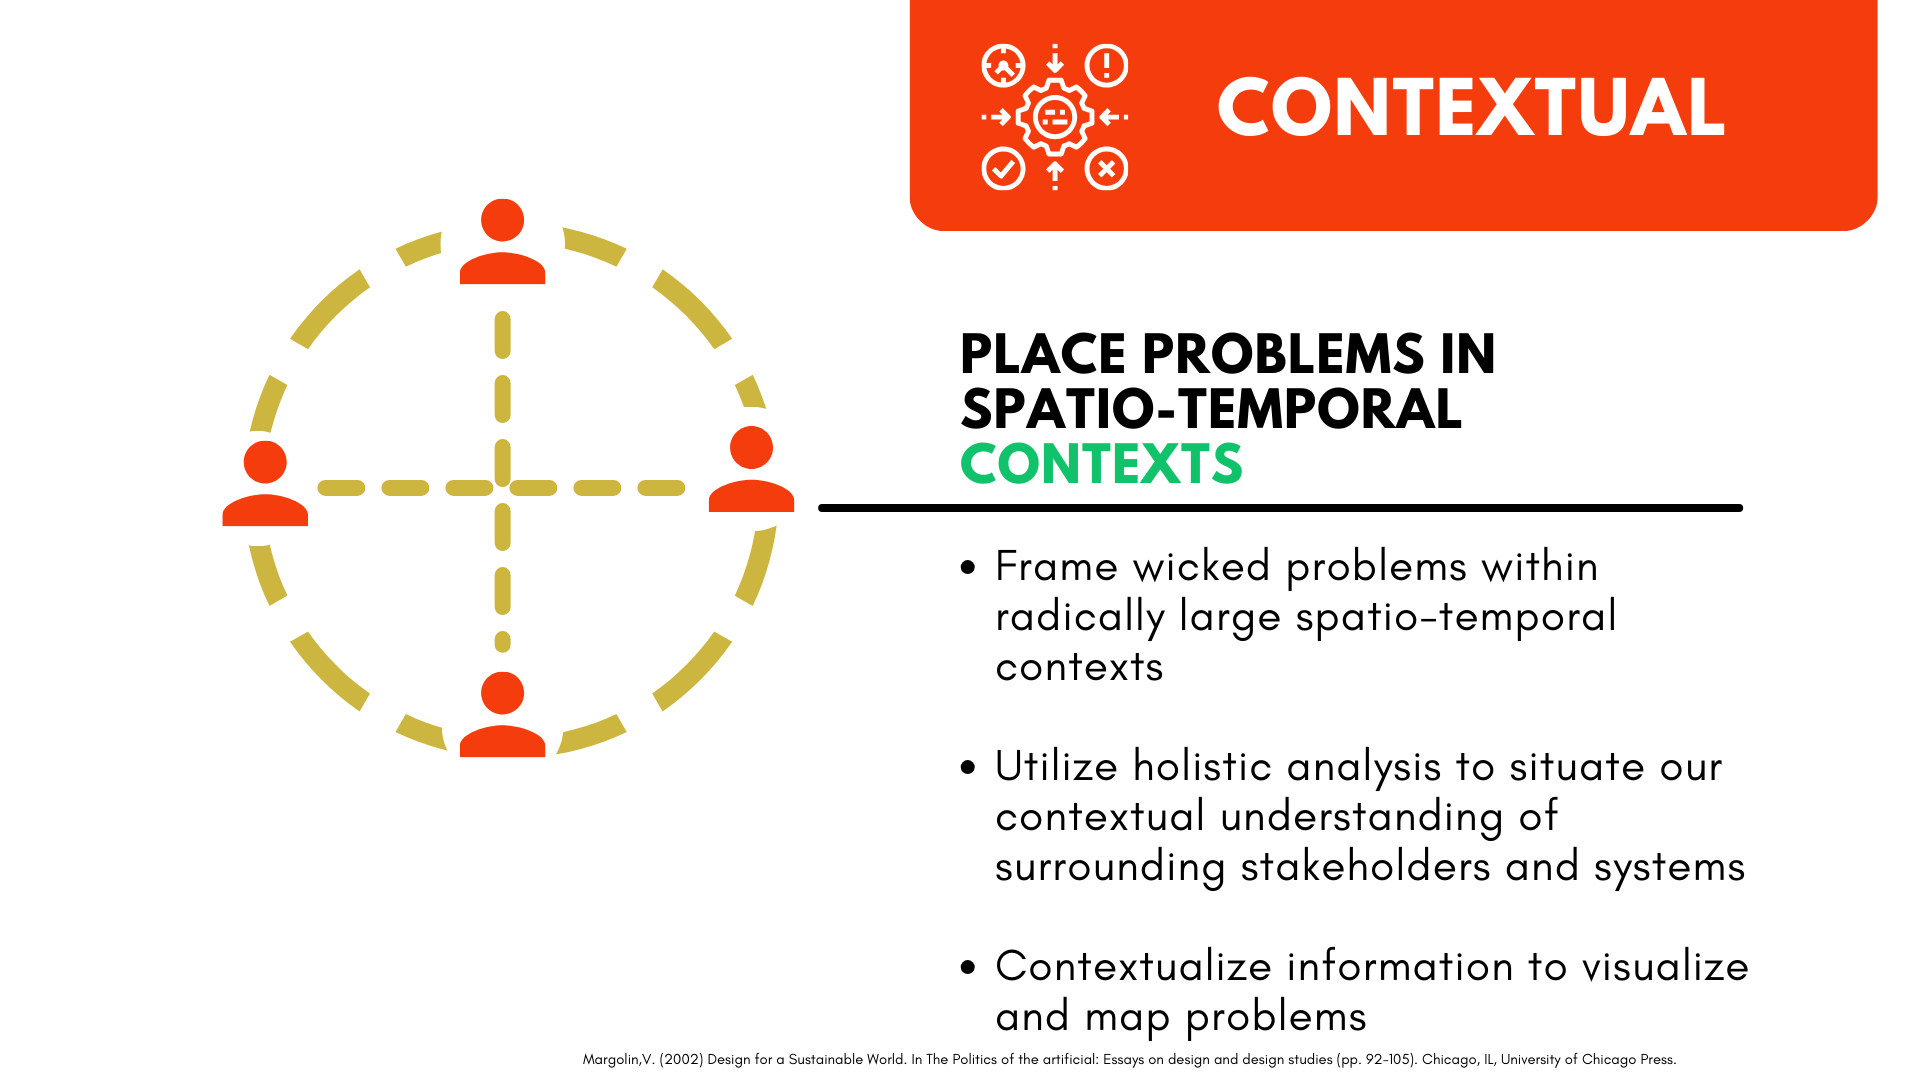
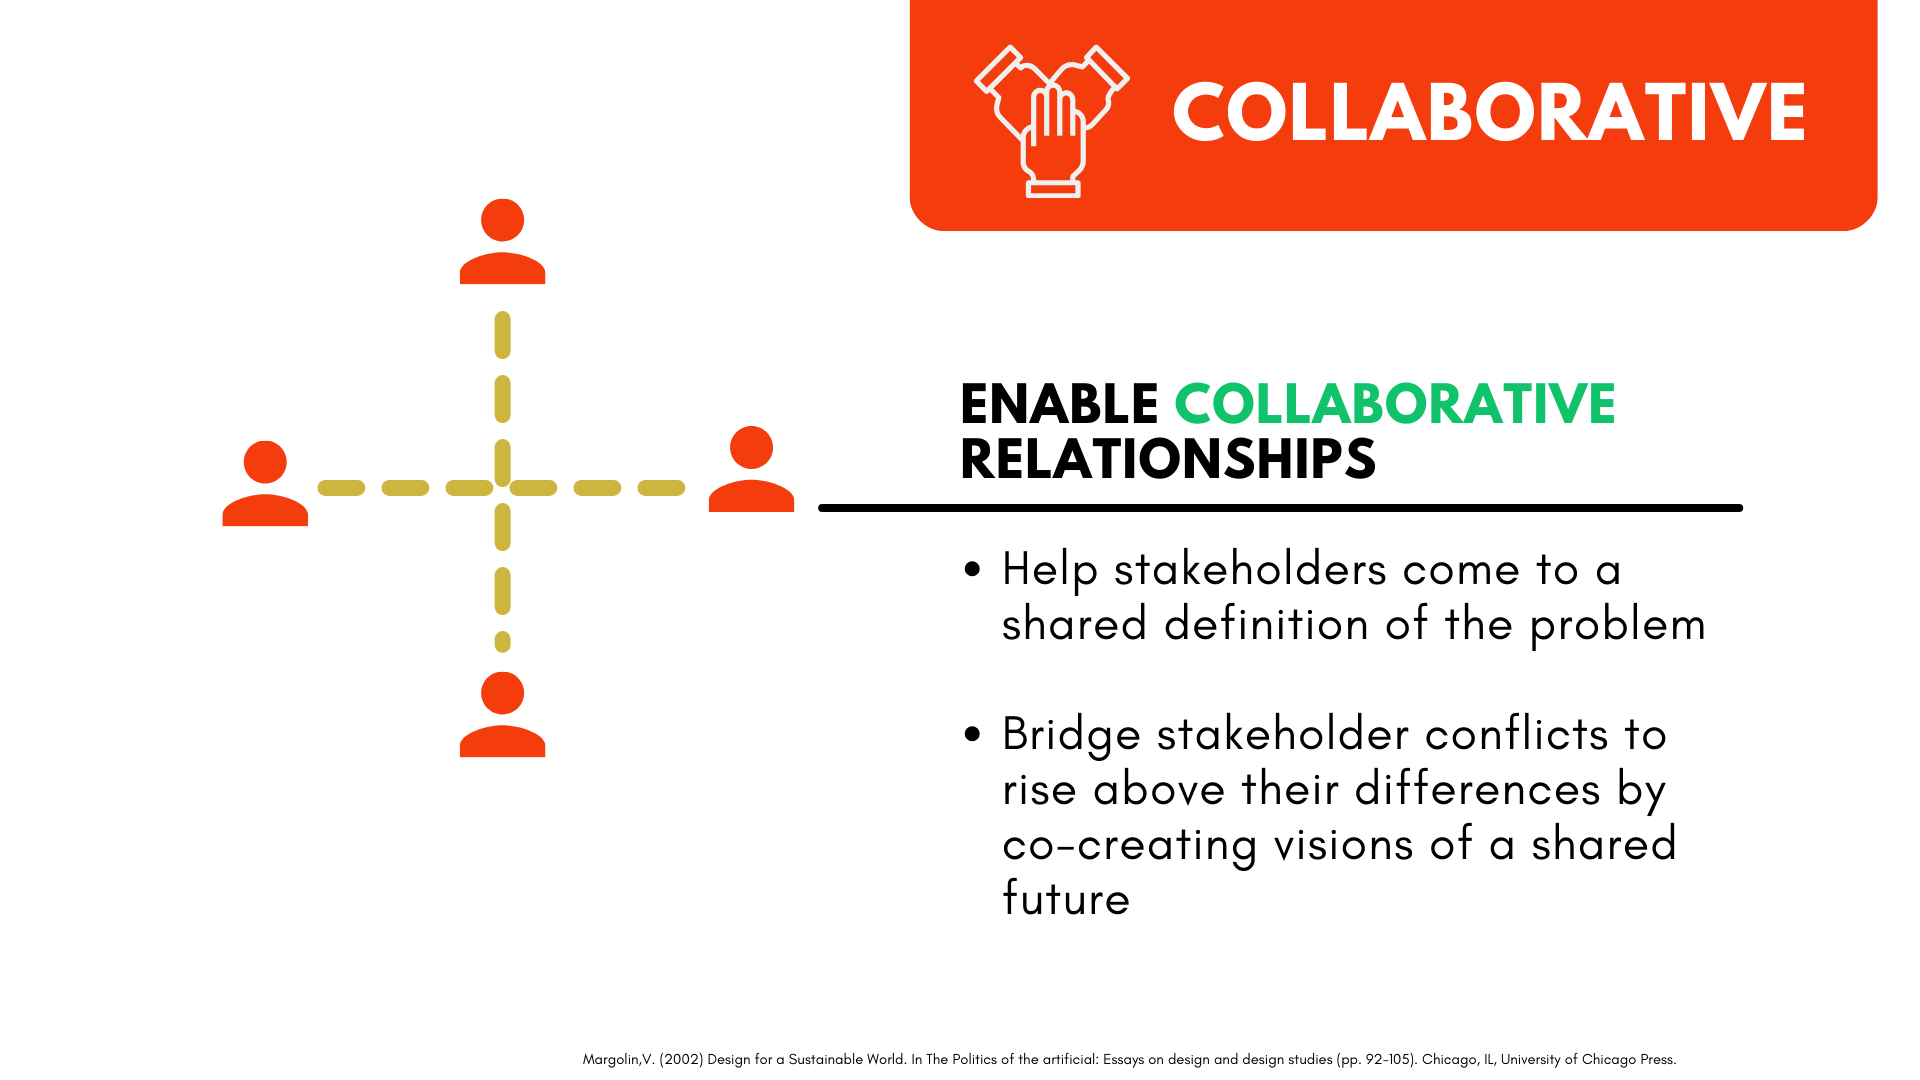
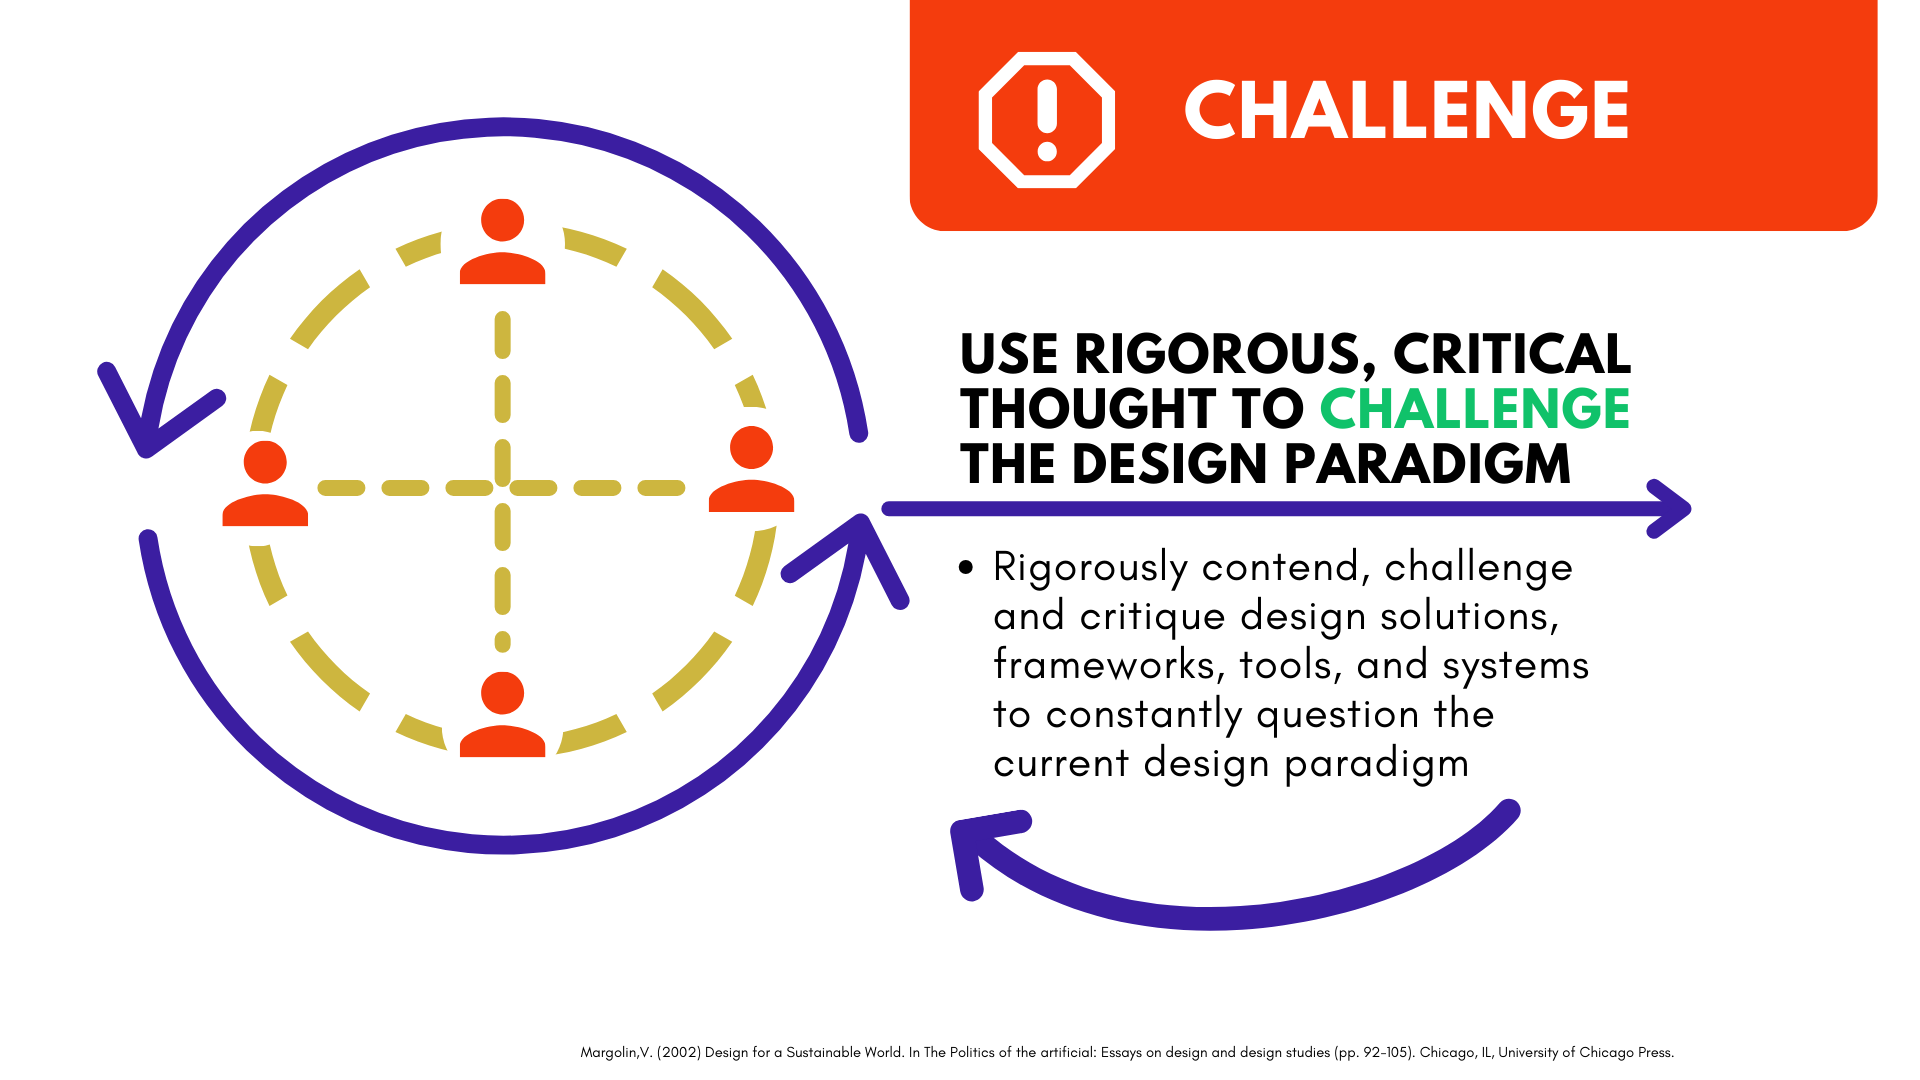
THE 7 C’s for sustainabLE DESIGN
A NEW DESIGN THEORY BY ROBIN OWENS


BACK
RESET
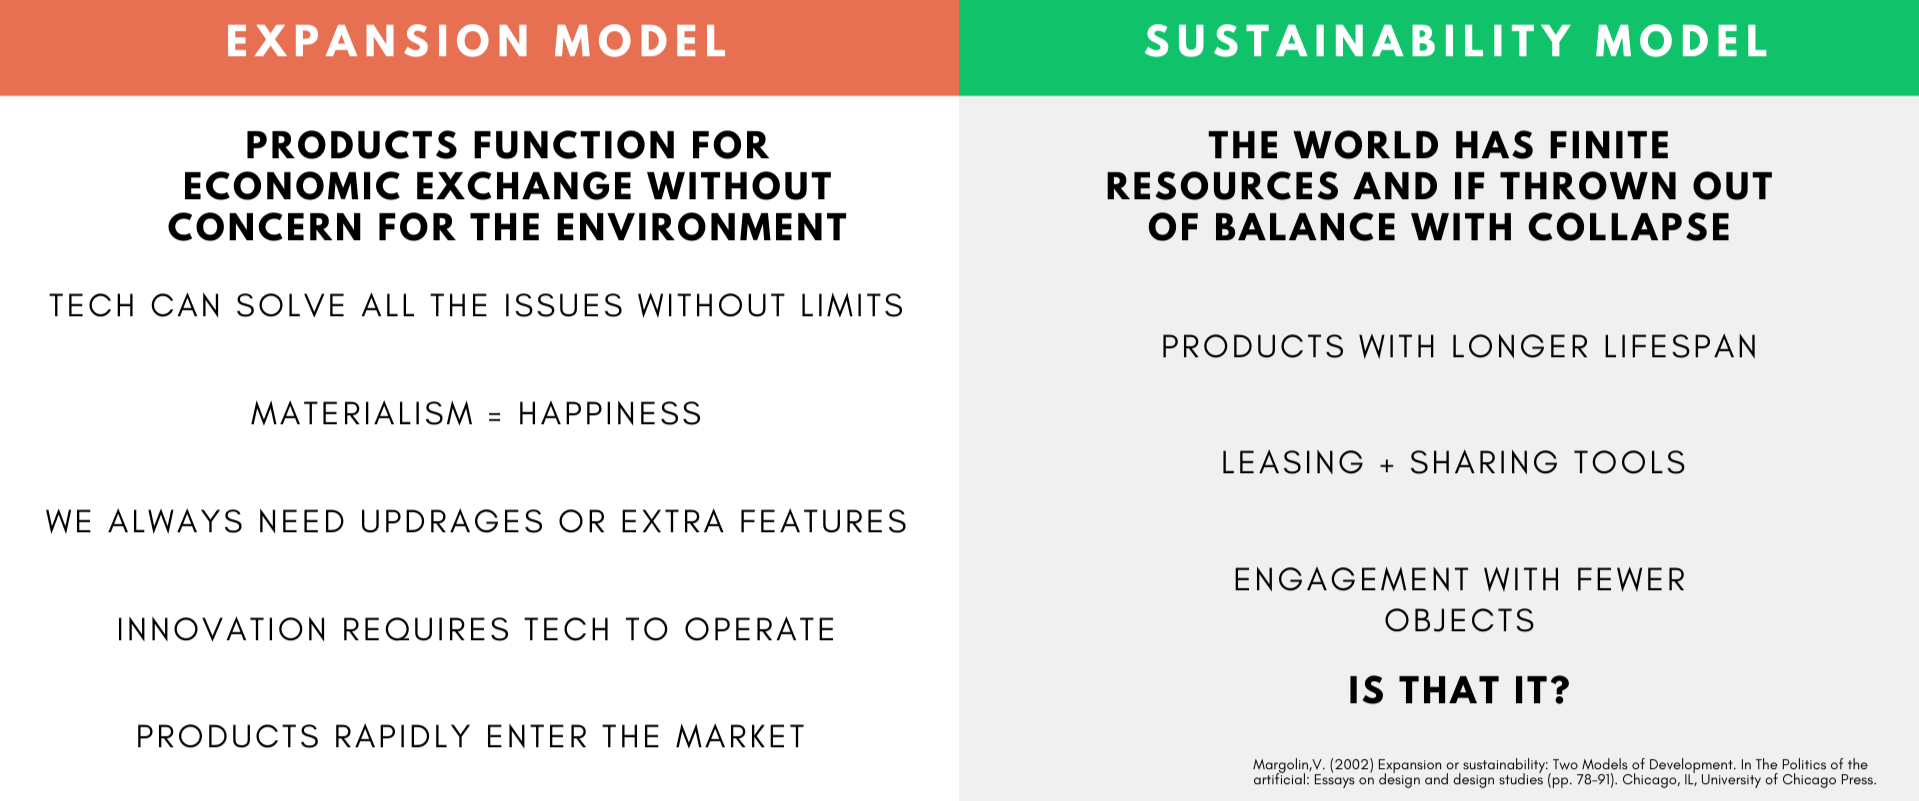
A BRIEF HISTORY OF SUSTAINABLE DESIGN
MODELS FOR DESIGN
CONTEMPORARY
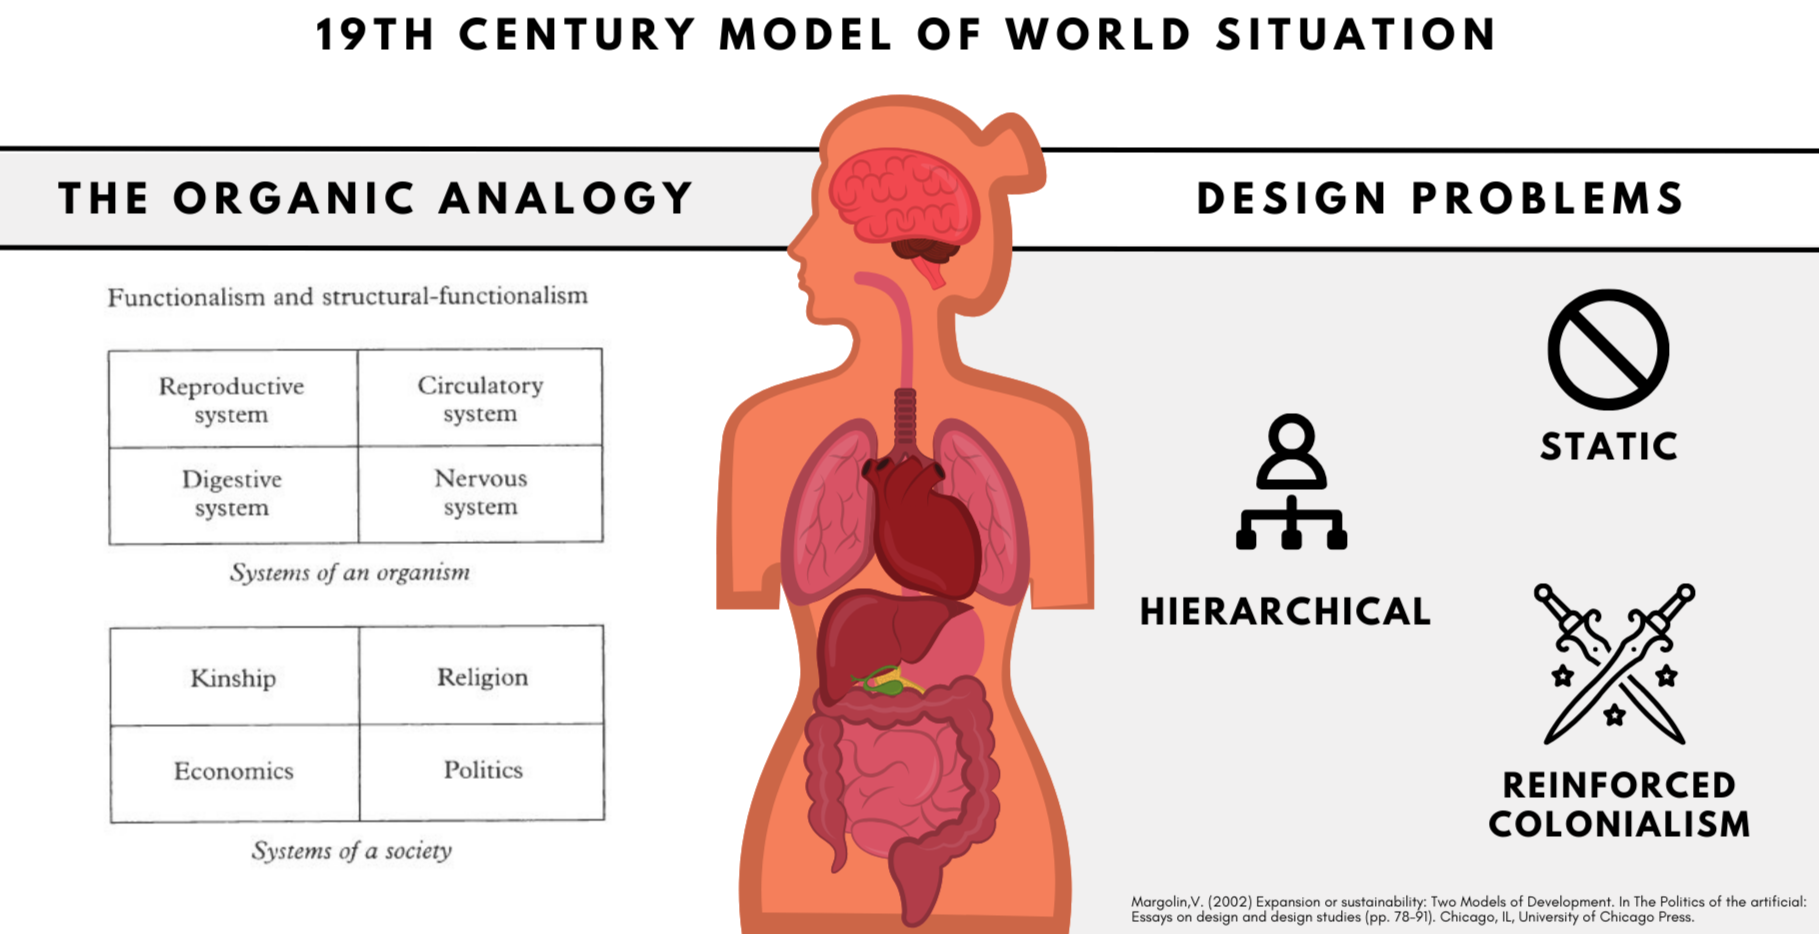
PAST
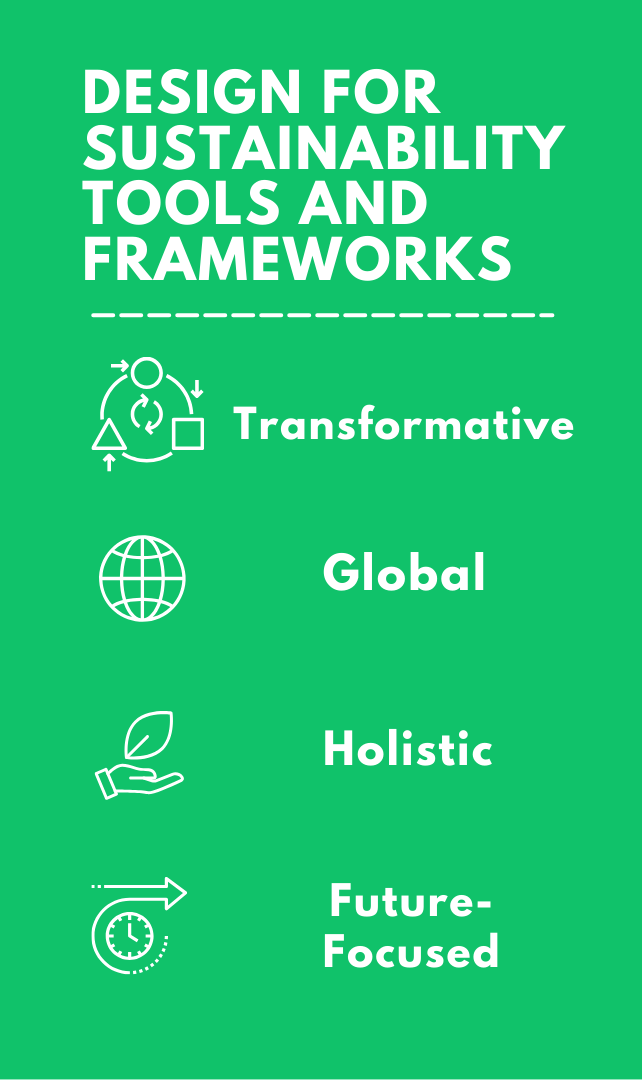
SUSTAINABLE DESIGNER TOOLKITS
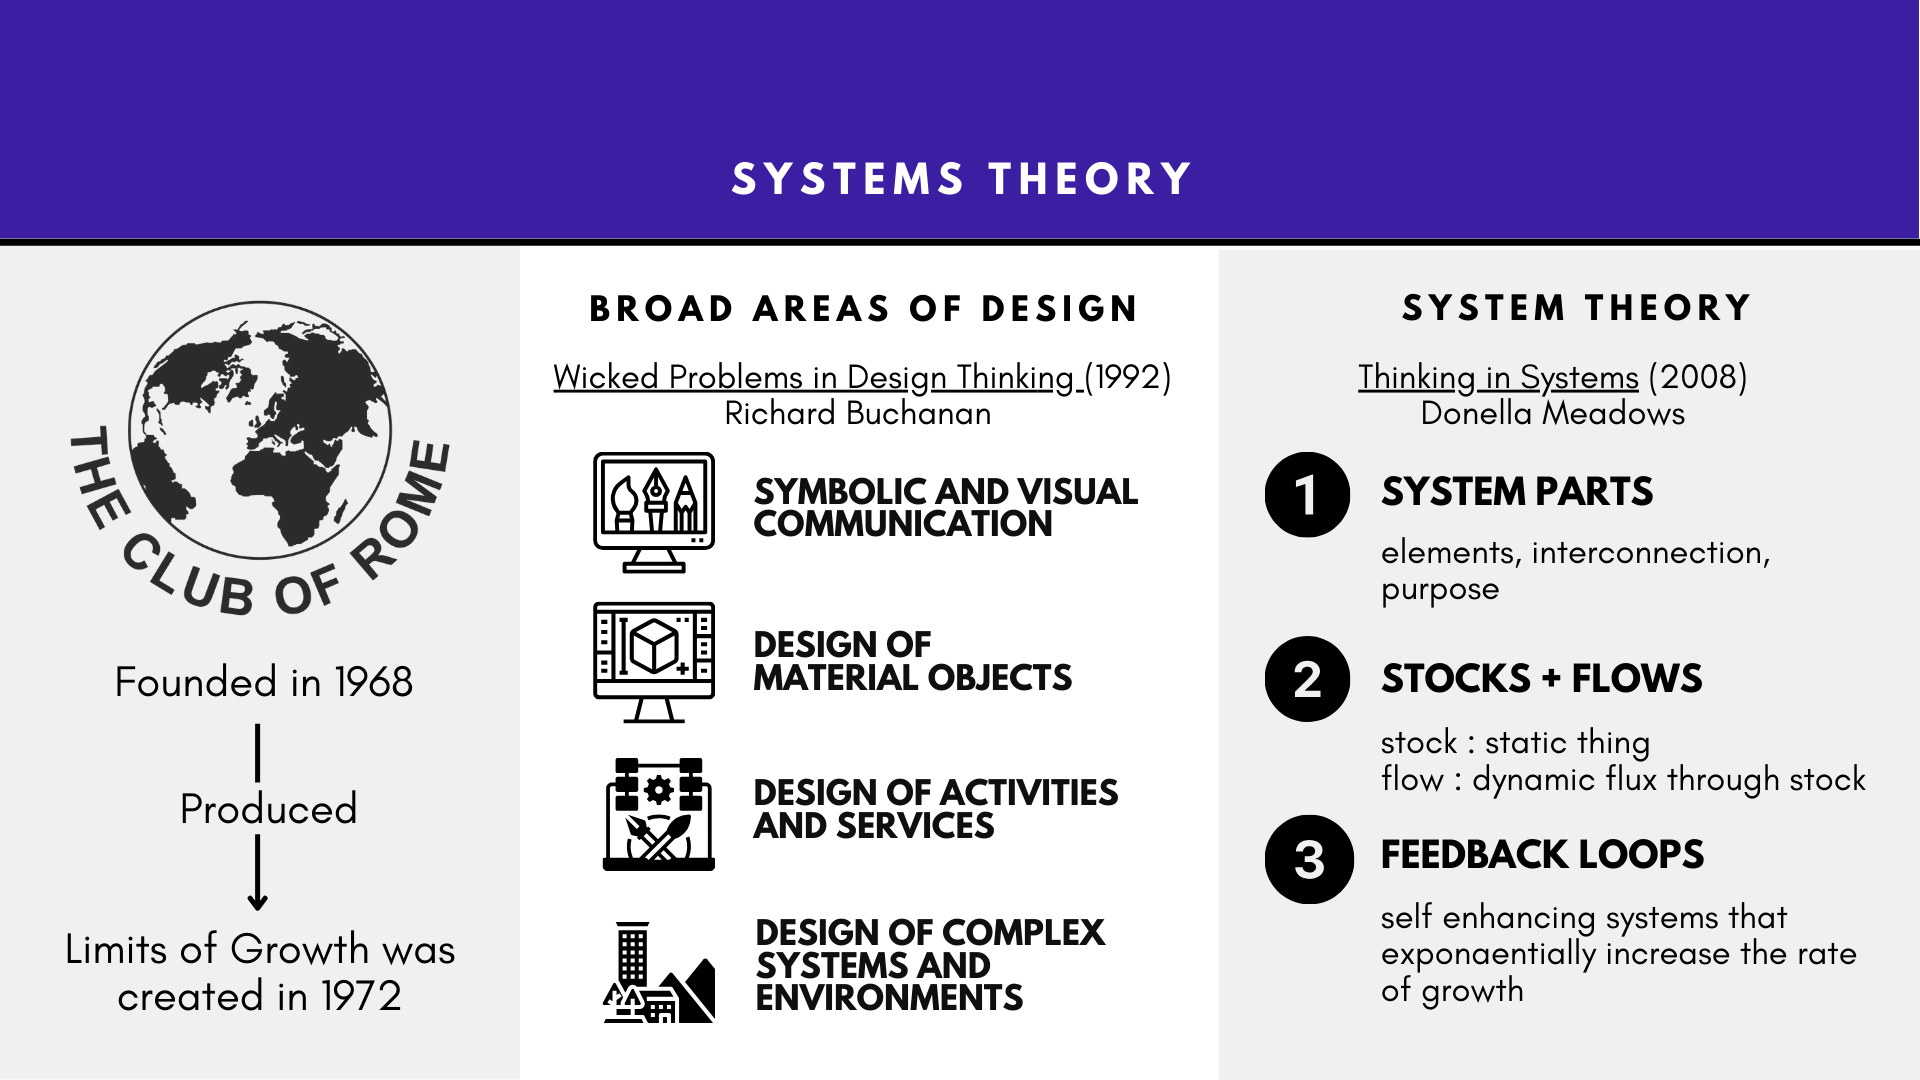
THEORIES FOR SUSTAINABLE DESIGN
SYSTEMS THEORY
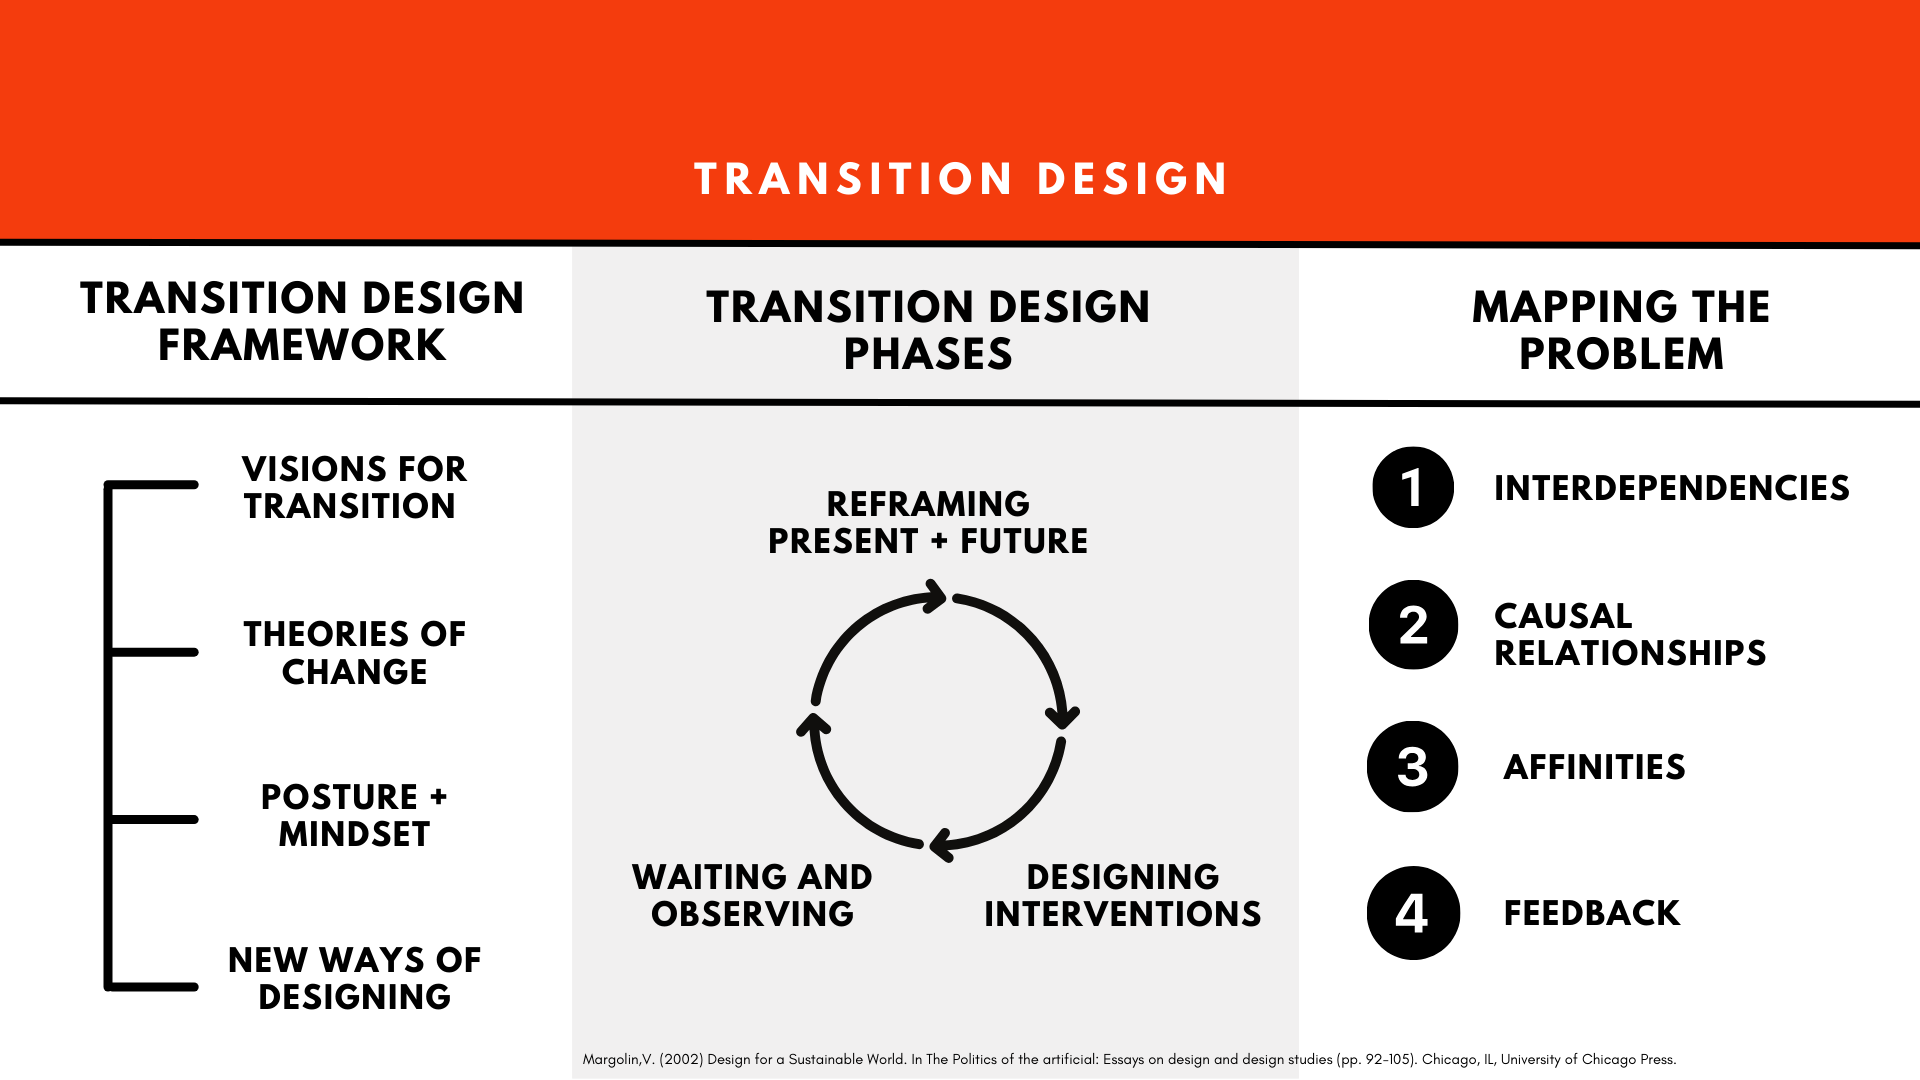
TRANSITION DESIGN
CAUSAL LOOPS
A System’s Thinking Tool
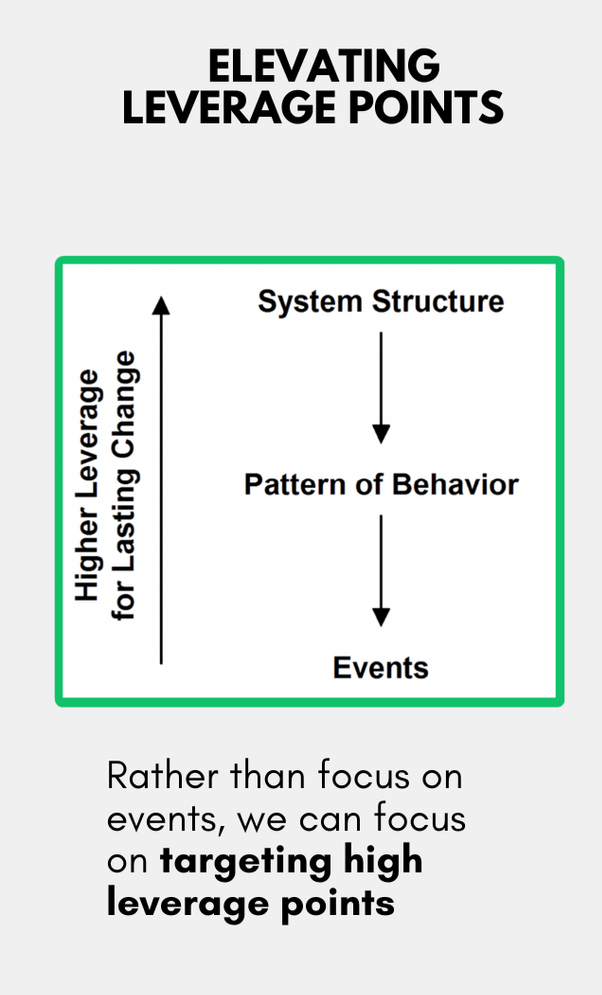
ELEVATING LEVERAGE POINTS
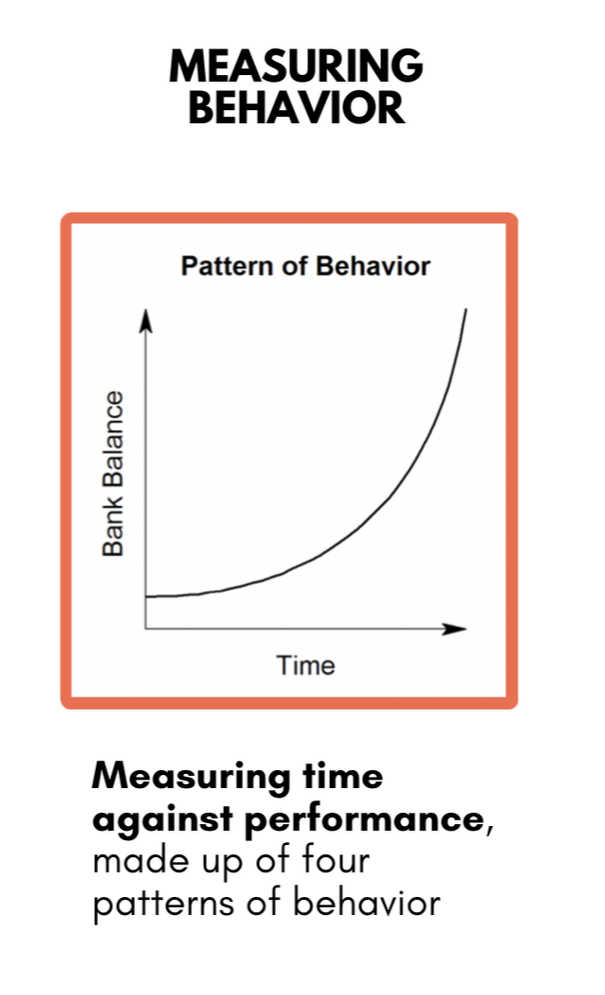
MEASURINg BEHAVIORS
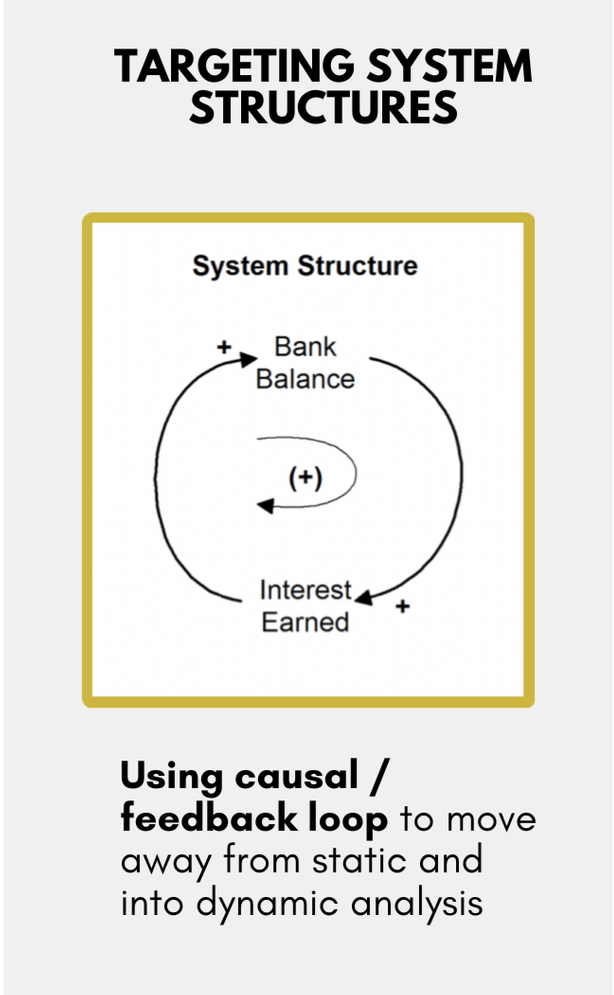
TARGETInG STRUCTURE SYSTEMS
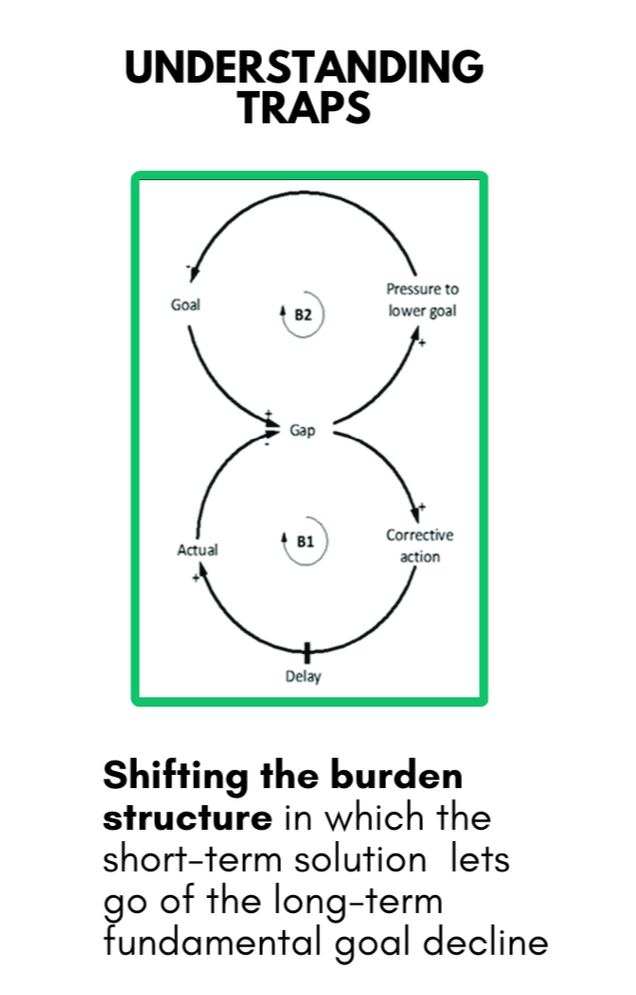
UNDERSTANDing TRAPS
highlighted projects
-
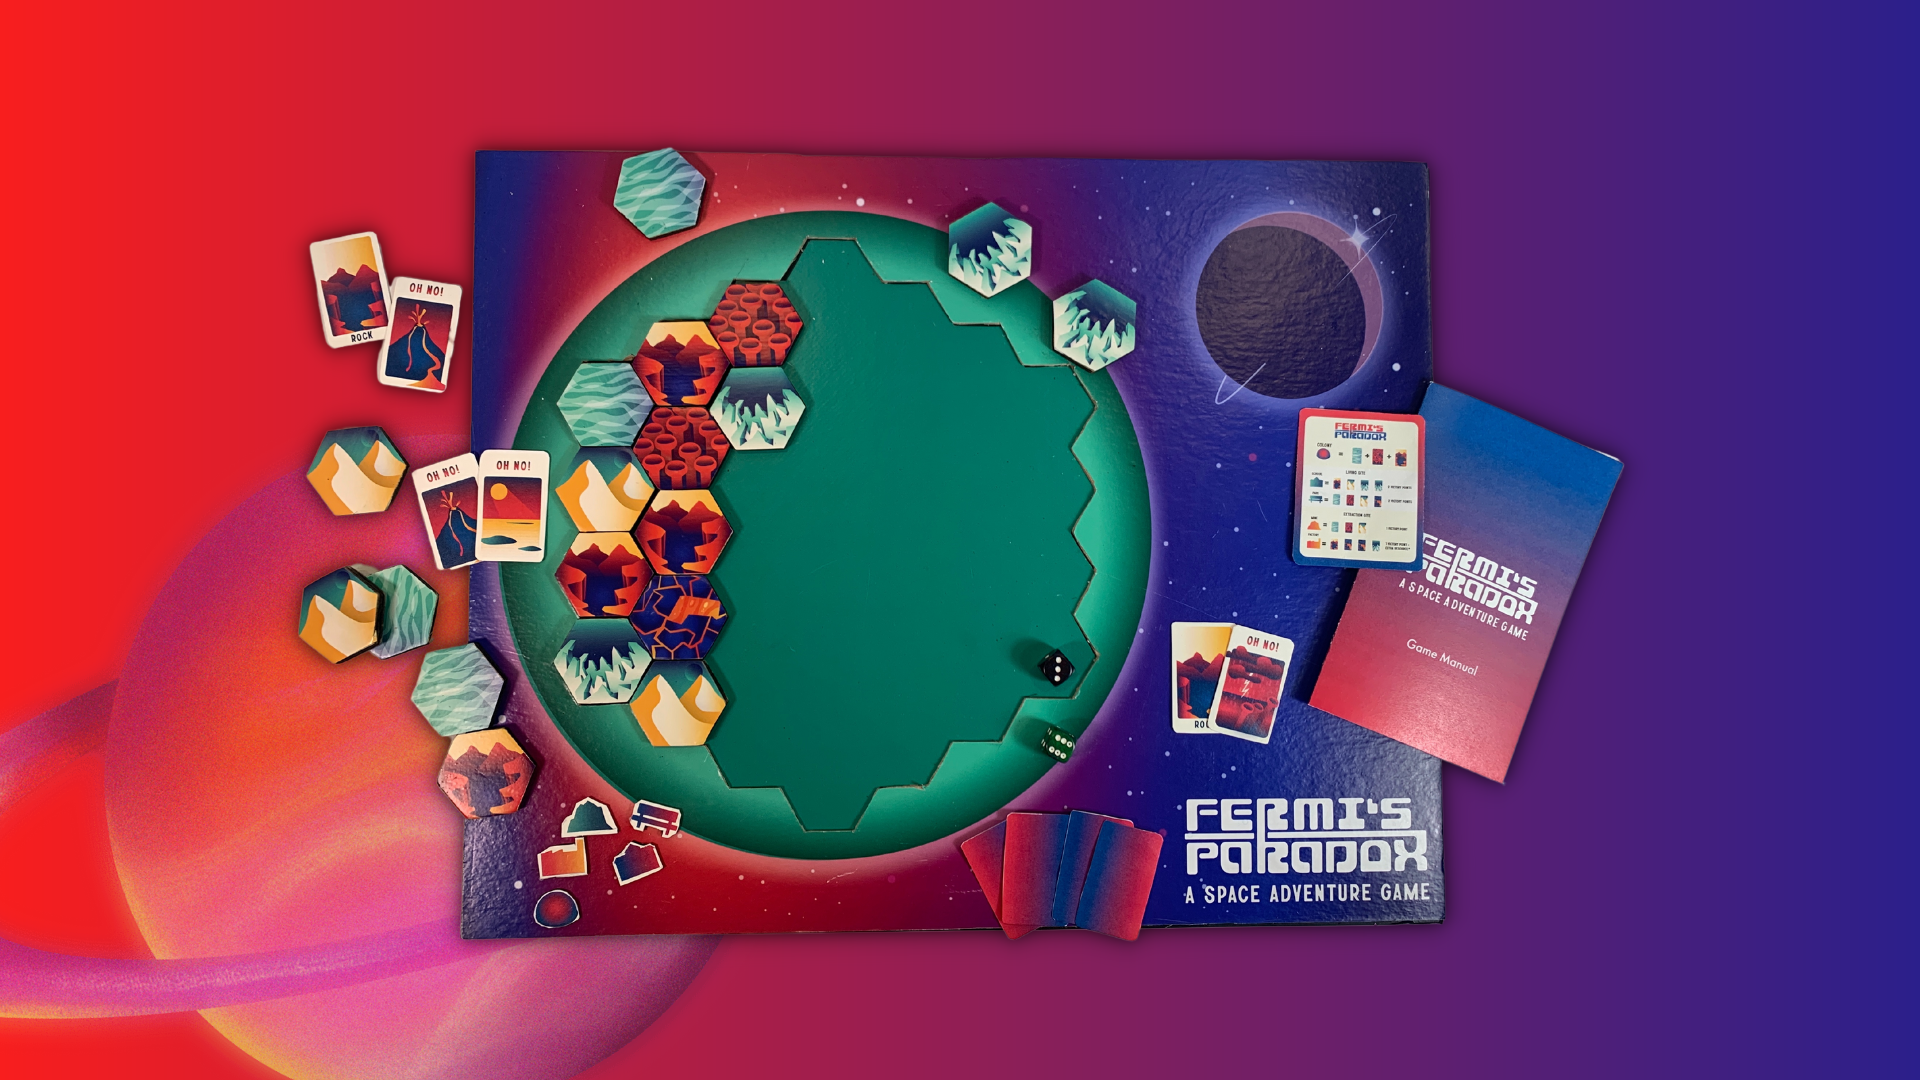
Fermi's Paradox Board Game
In this space adventure, multi-player game, players compete to gain resources and build colonies on an alien planet. However, players better not take too much from the planet, or else all players lose the game.
-
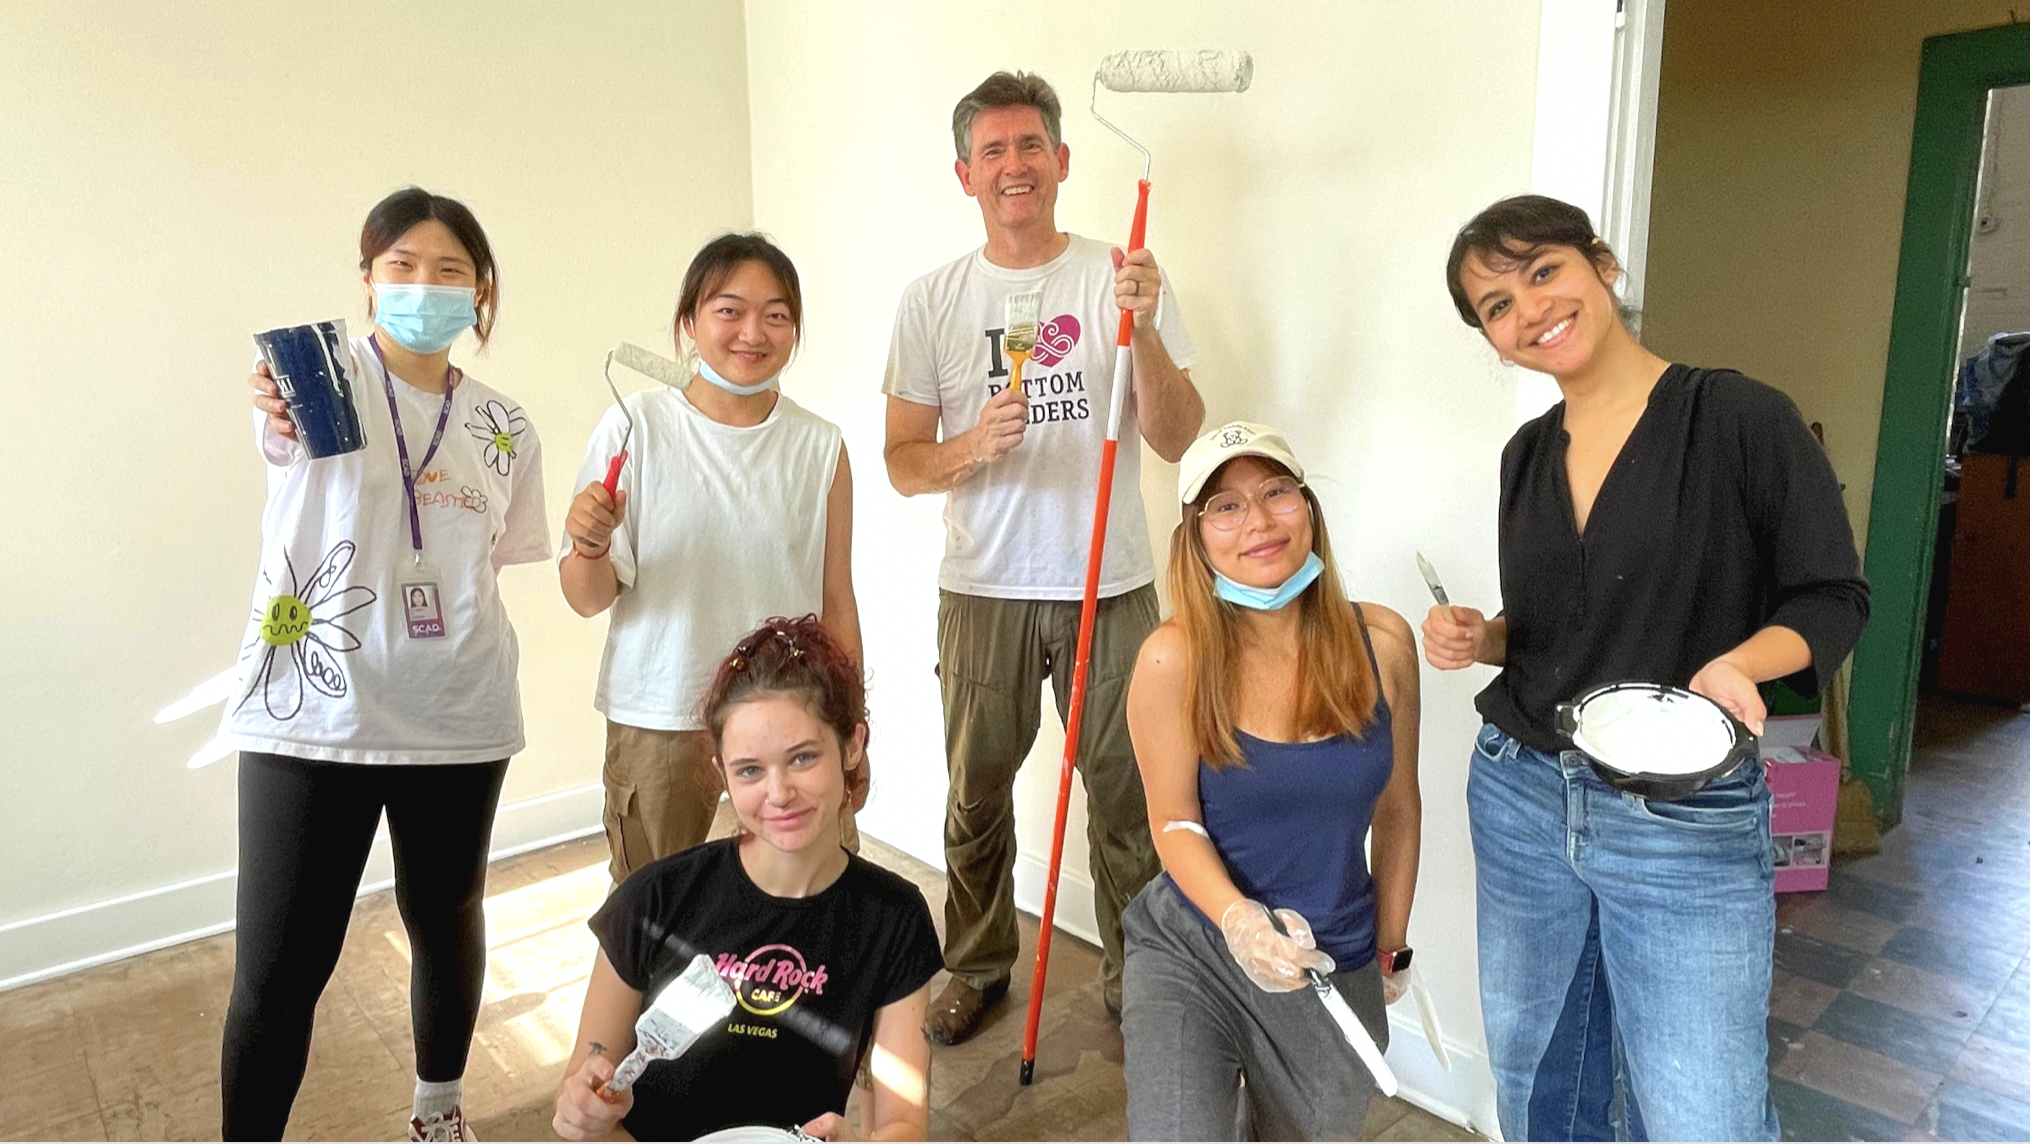
Emmaus House CLOTHING CLOSET
Though SCAD Serve, our team collaborated with Emmaus House and the United Ministries of Savannah to reimagine the efficiency of their Clothing Closet, which provides essentials for Savannah’s unhoused population.
-

PELTE BIOMEMETIC SHADING DEVICE
Though the study of biomimicry, Pelte was invented as an adaptive response to changing climate conditions, modeled after the Resurrection Fern, a plant native to Savannah.