STRATEGIZE
RESEARCH APPLICATION
Ethnographic research is translated into actionable design strategies by synthesizing insights into clear frameworks and models that guide decision-making and prioritize human needs. Then we craft persuasive pitches, polished presentations, and concise data visualizations that communicate those strategies with clarity, impact, and sustainable design principles.
FRAMEWORKS AND MODELS
Frameworks and models translate design intent into actionable decisions by structuring information, clarifying priorities, and aligning stakeholders. They turn complexity into repeatable processes that guide research, ideation, and implementation.
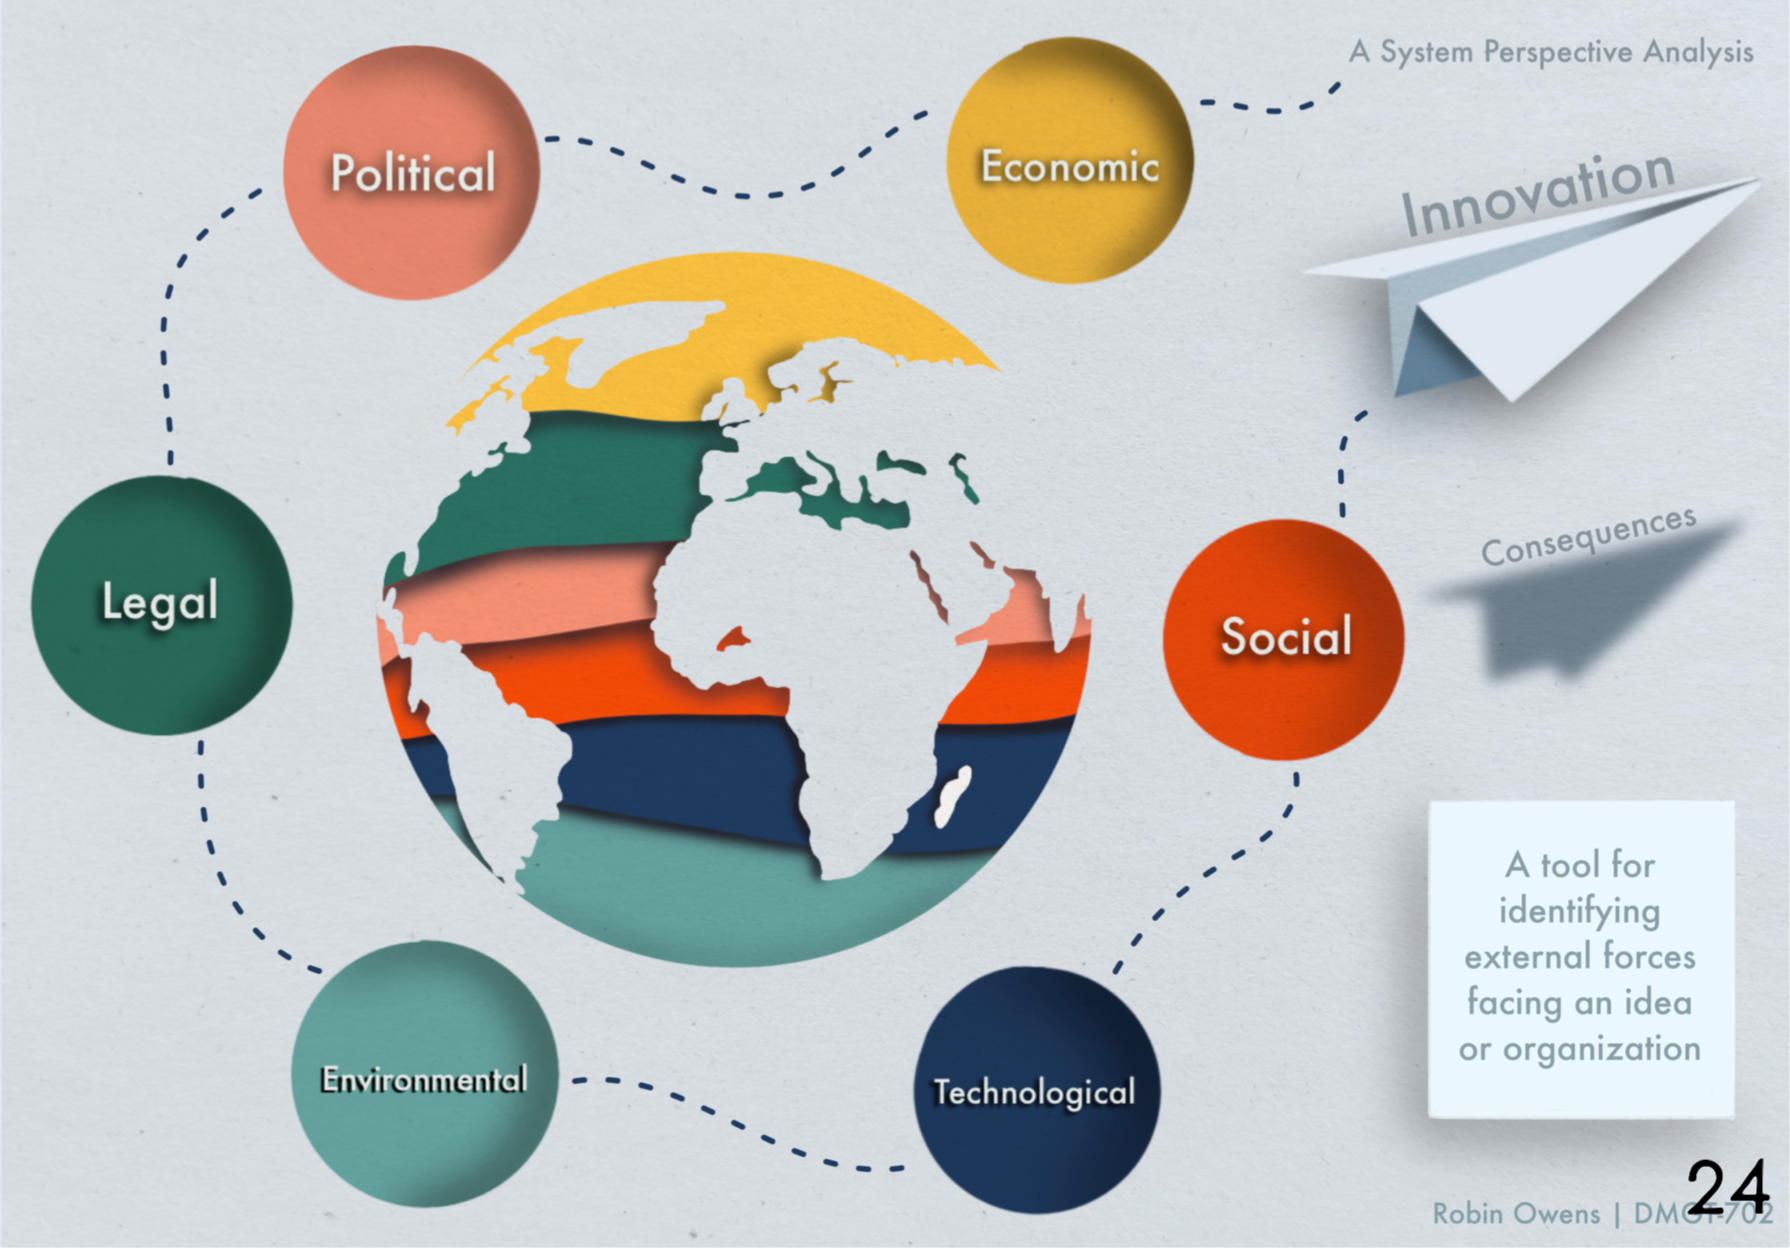
Visualization of P.E.S.T.E.L. Framework
Stakeholder Engagement Maps
Visualize who influences or is affected by a project, their needs, influence level, and communication preferences. Use them to prioritize outreach, tailor messages, and reduce risk from overlooked stakeholders.
ERRC analysis (Eliminate-Reduce-Raise-Create)
Surface strategic shifts by asking which factors to eliminate, reduce, raise, or create. Useful for product positioning, service design, and reframing user value.
Empathy Map
An empathy map is a simple, visual tool that helps teams understand users by organizing what they say, think, do, and feel. Use it to align design decisions with real user needs and motivations.
Strategy Canvas
This canvas measures design solutions along a specialized set of criteria to compare and contrast insights from mixed-methods research.
Theory of Change
A theory of change design tool is a structured framework that maps how specific activities and resources are expected to lead to short-term outcomes and long-term impact, making assumptions and causal links.
Eisenhower Matrix
The Eisenhower Matrix organizes tasks into four quadrants by urgency and importance to prioritize work that drives design impact. It helps teams focus limited resources on high-impact activities while delegating or scheduling less critical tasks.

A.U.U.D.D.I.O. Analysis
Categorize tasks by urgency and importance to focus limited resources on what moves the design forward. Helps teams avoid busywork and schedule deliberate time for strategic design activities.
Persona Development
Personas illustrate potential users for a design solution, identifying pain points, goals, and needs in order to best serve the targeting consumer base.
Fogg’s Behavioral Model
Fogg's behavioral model identifies how behavior change can be achieved by manipulating motivation, ability, and prompts, guiding designers to make desired actions easier and more appealing.
Attributes of Innovation
A model for assessing innovation—evaluates relative advantage, compatibility, complexity, trainability, and observability. Scoring each attribute on clear, weighted criteria enables objective comparison across ideas and guides resource allocation toward the highest-value opportunities.
Value Proposition Canvas
The Value Proposition Canvas is a tool for assessing innovation by evaluating relative advantage, compatibility, complexity, trainability, and observability. Scoring each attribute with clear, weighted criteria enables objective comparison across ideas and guides resource allocation toward the highest-value opportunities.
DESIGNING ENGAGING PRESENTATIONS
PITCH DECKS

CAMPAIGN PROPOSAL
PRODUCT PROPOSAL
RESEARCH PROPOSAL


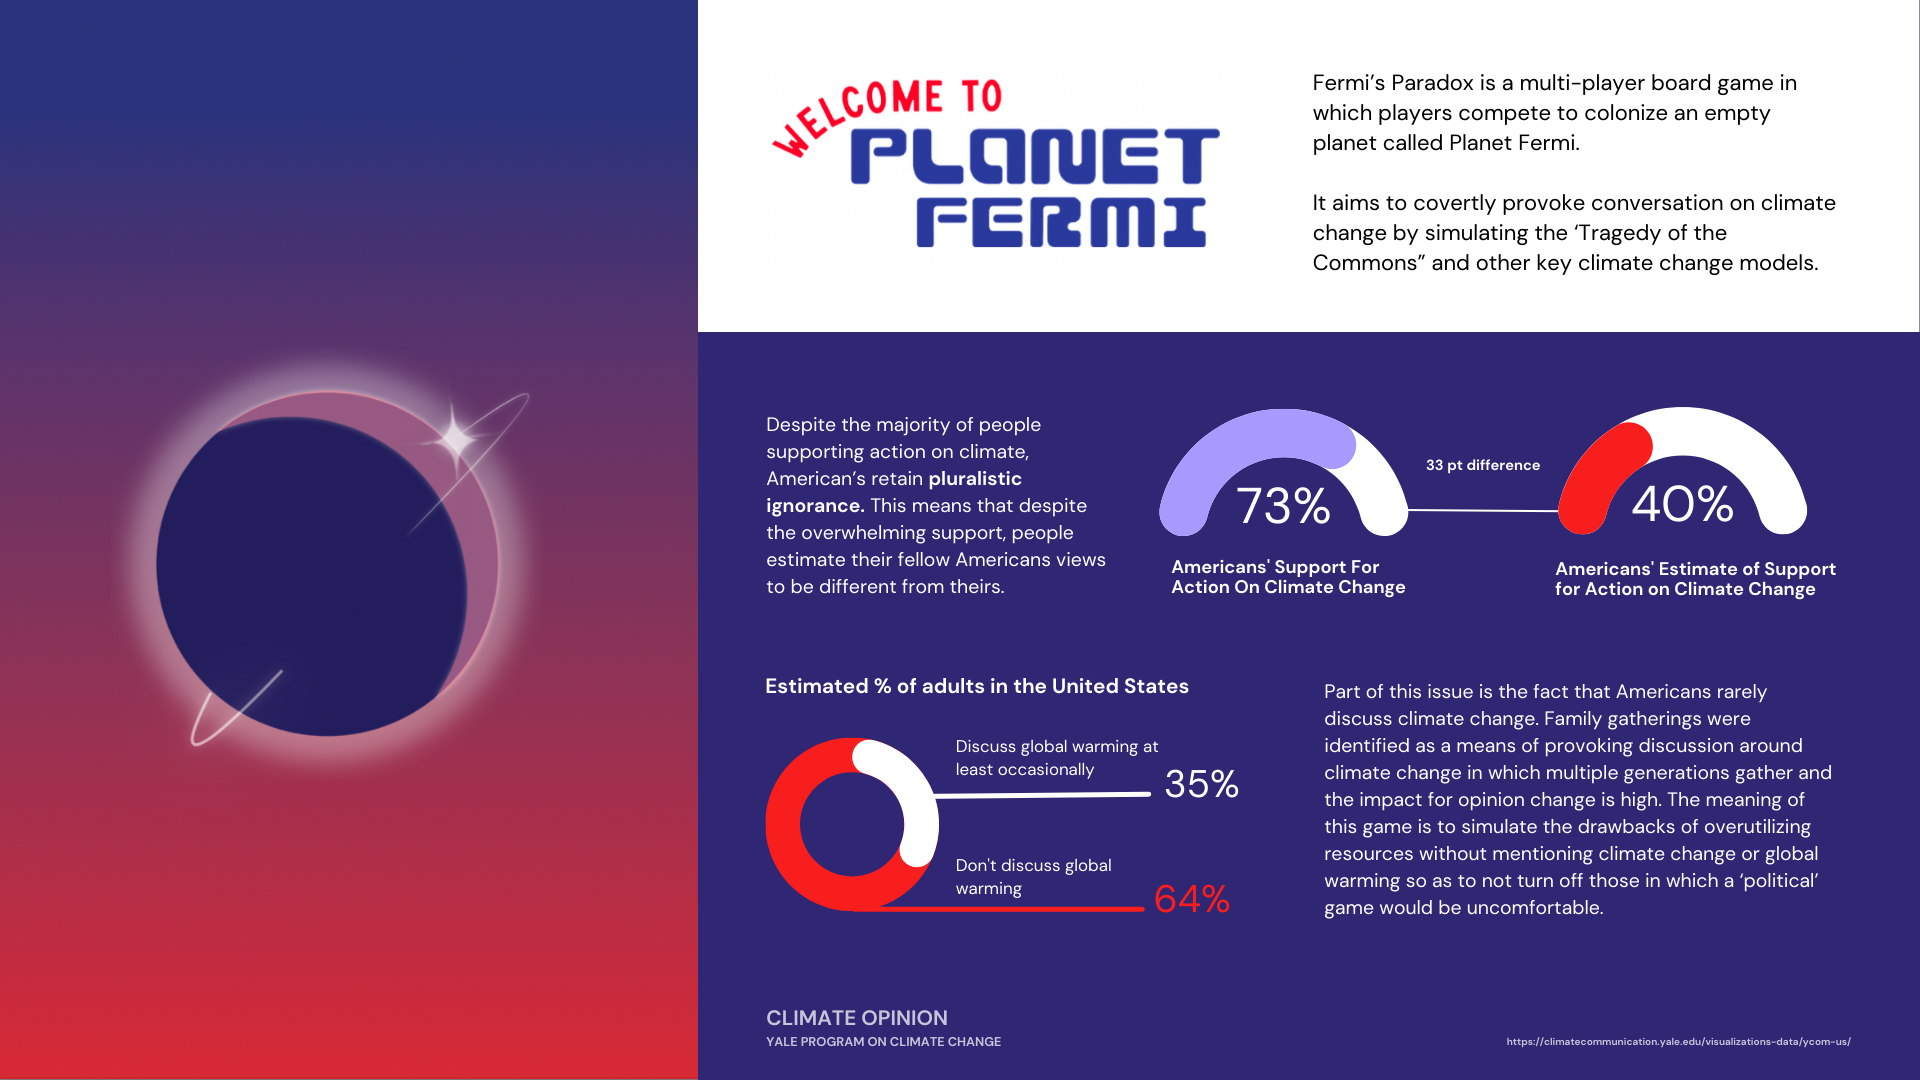
DATA VISUALIZATION
EDUCATION
Using data visualization to educate and spread awareness
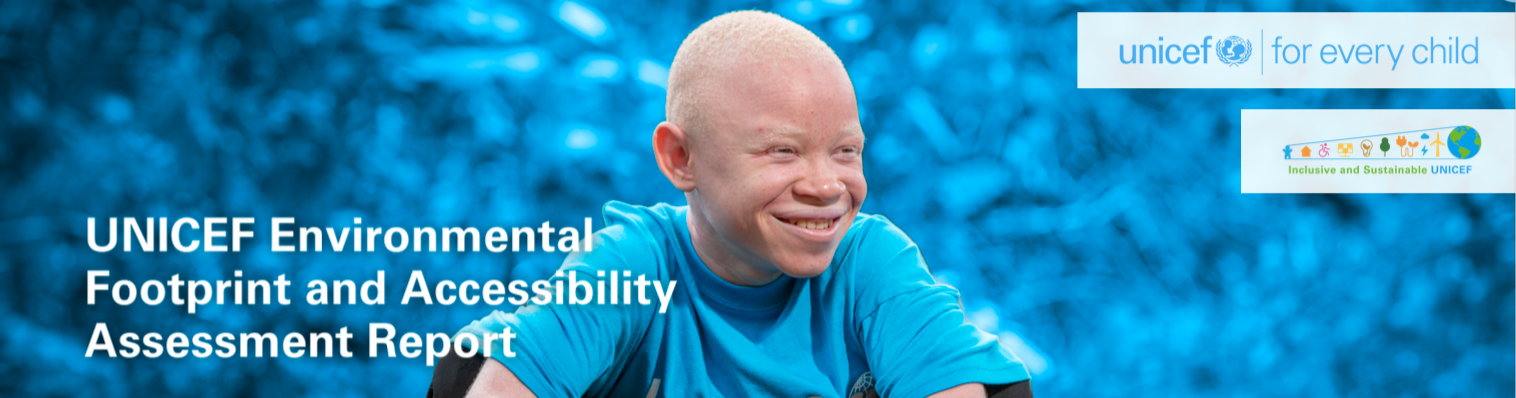
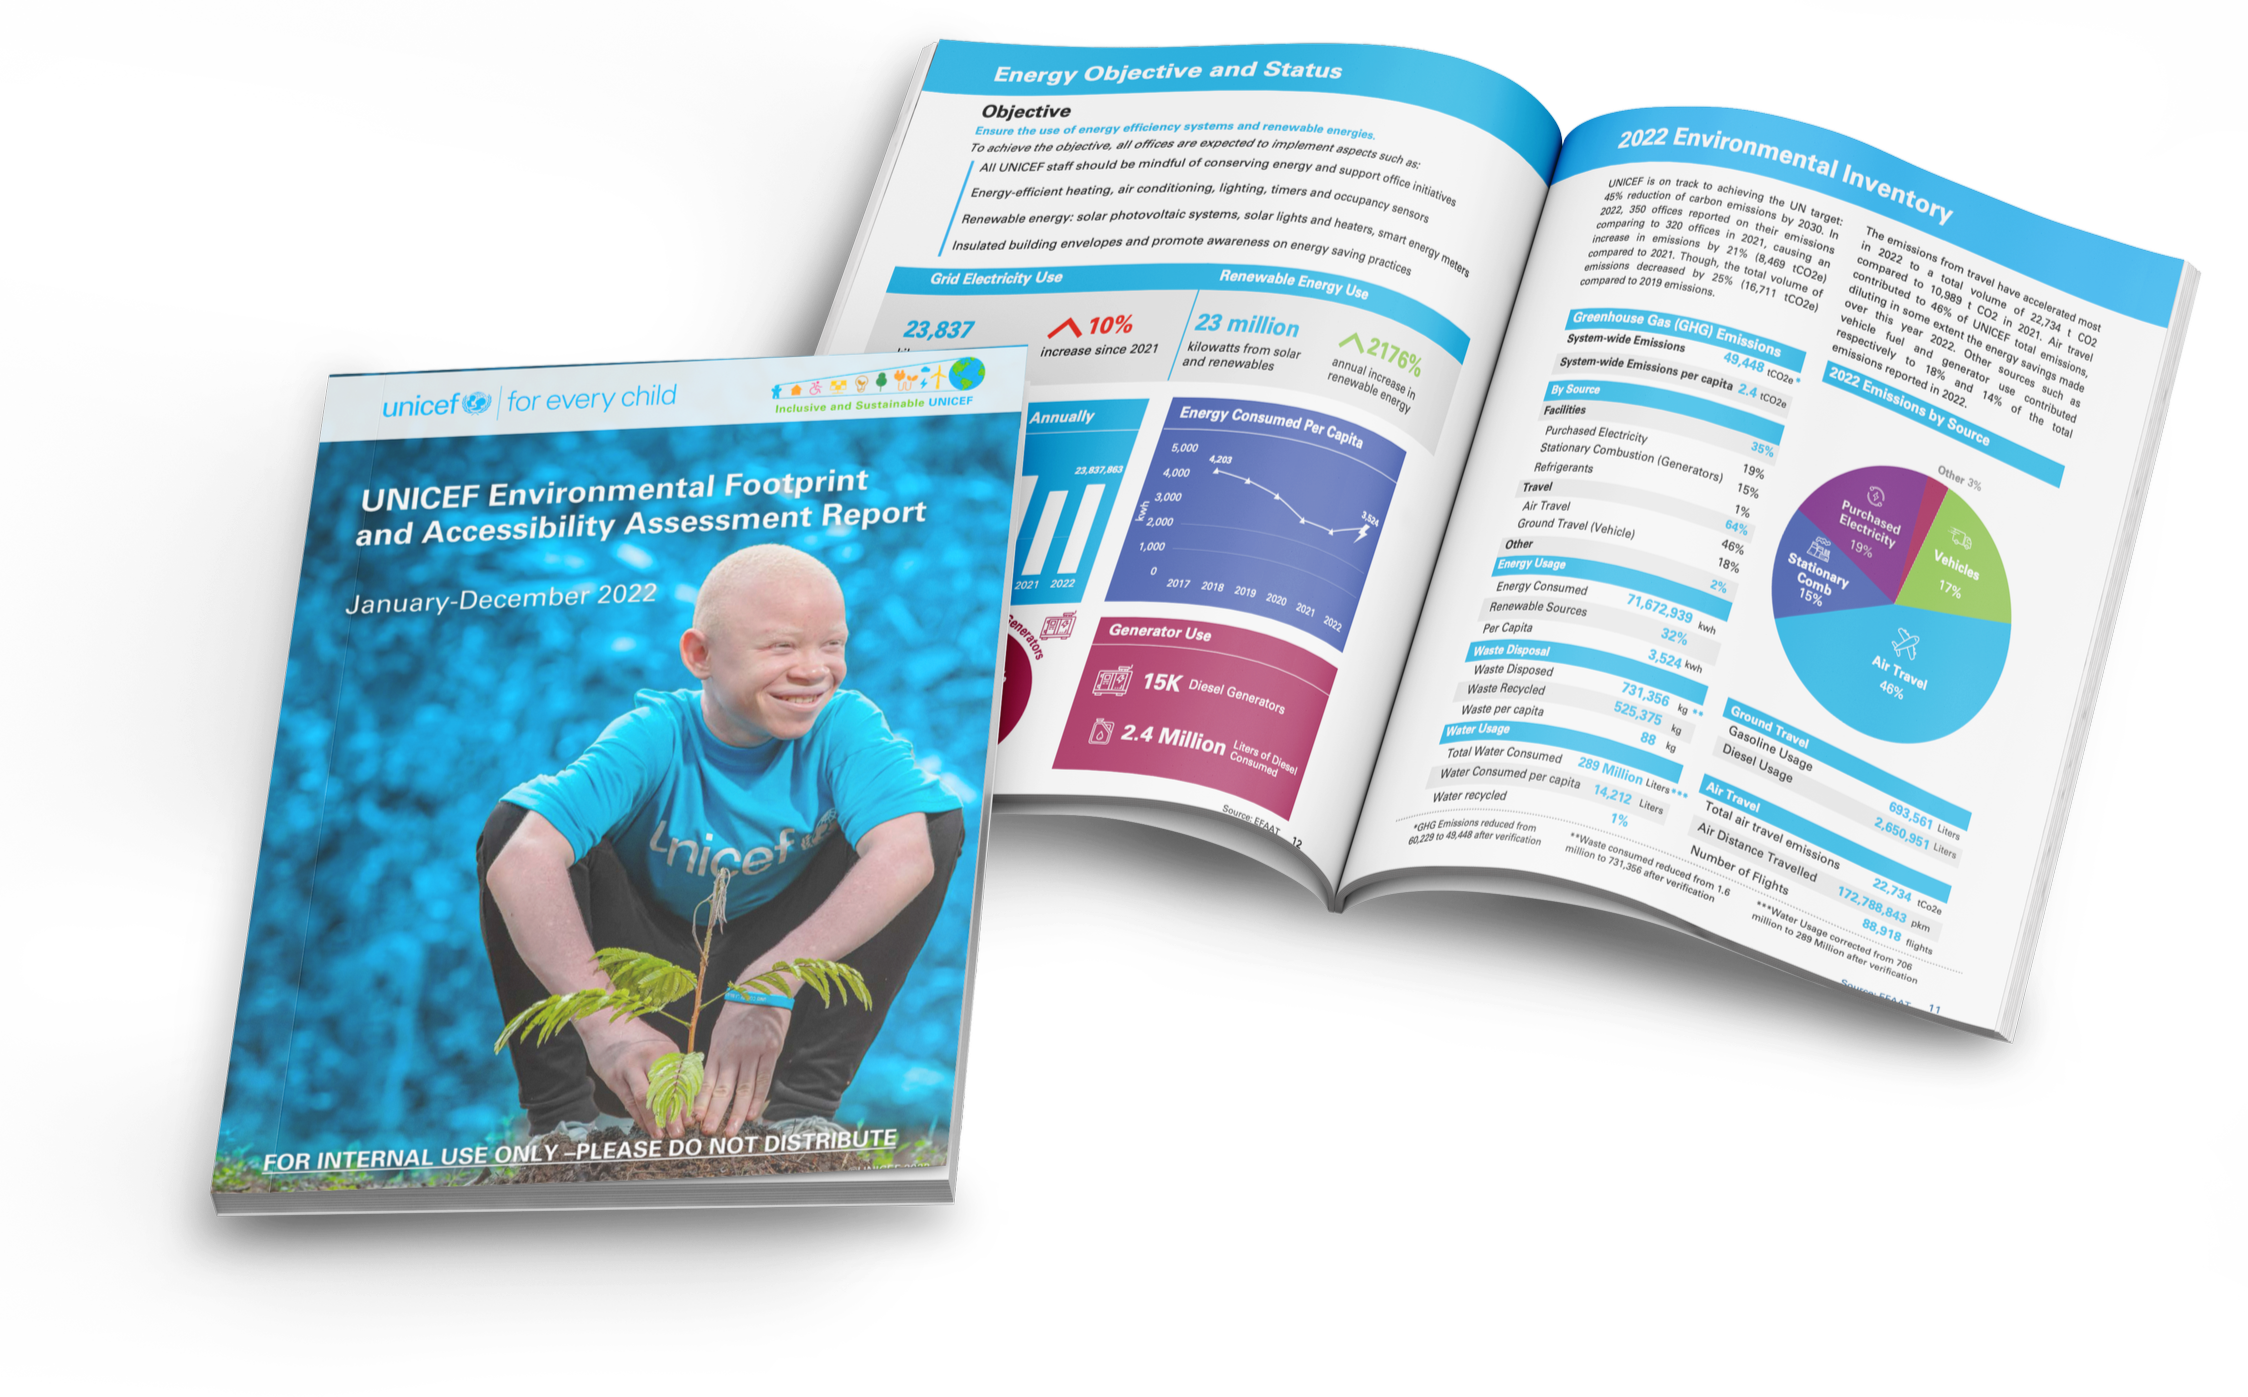
UNICEF Environmental Footprint Report and Carbon Neutrality Education
Distributed to both high-level stakeholders and over 13,000 internal agency employees to spread awareness on organizational activities and education around environmental footprint
OUTREACH
Using data visualization to engage stakeholders and encourage action
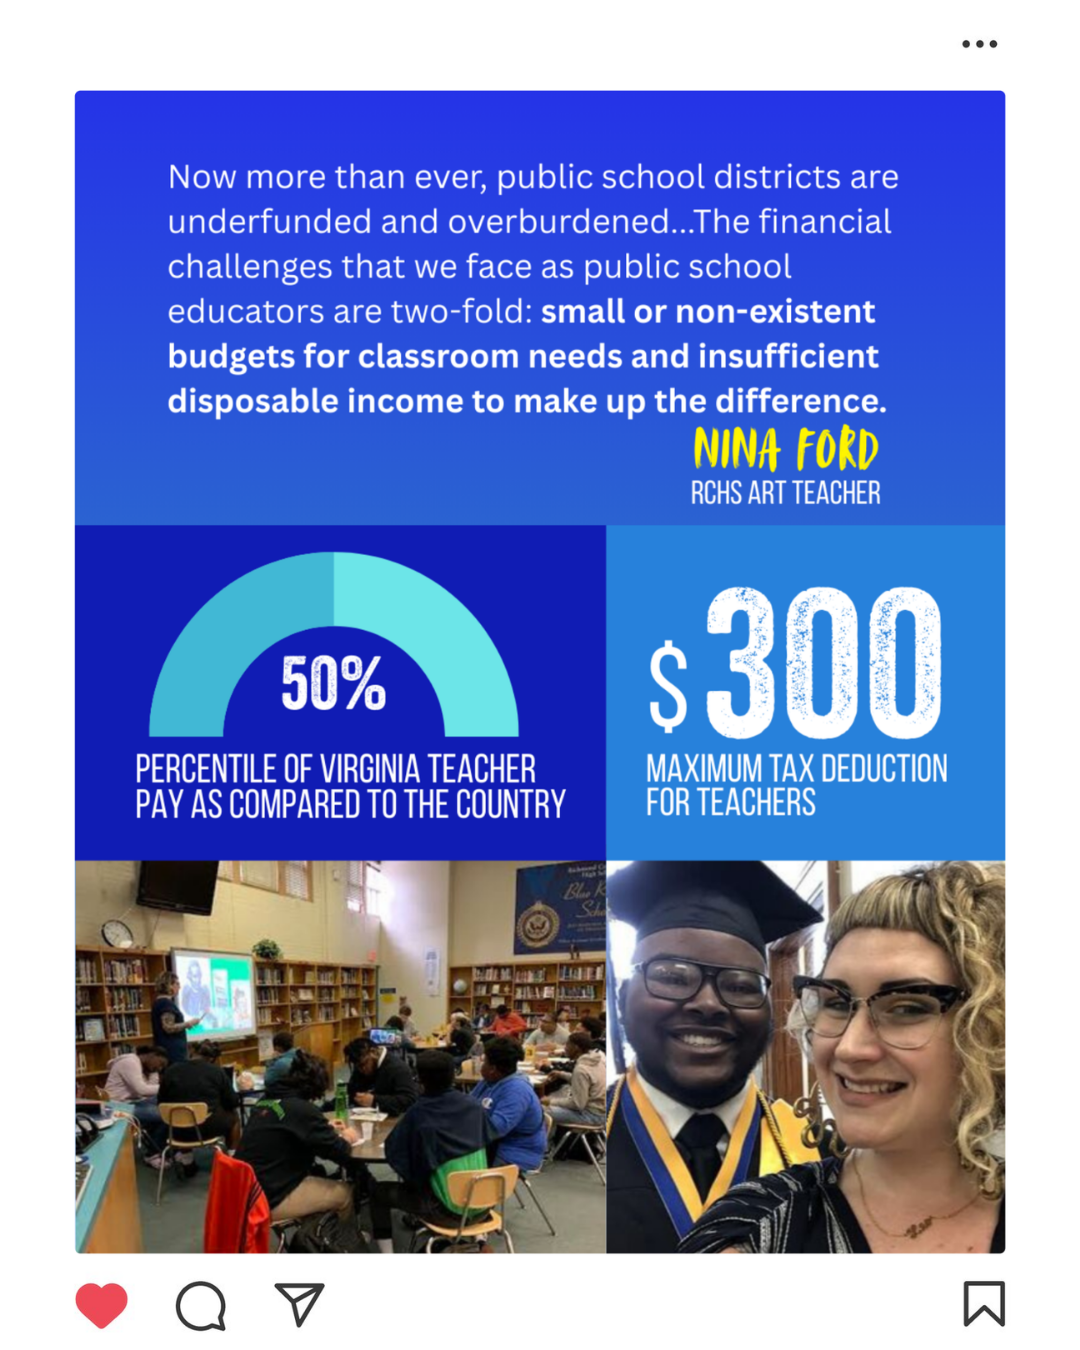
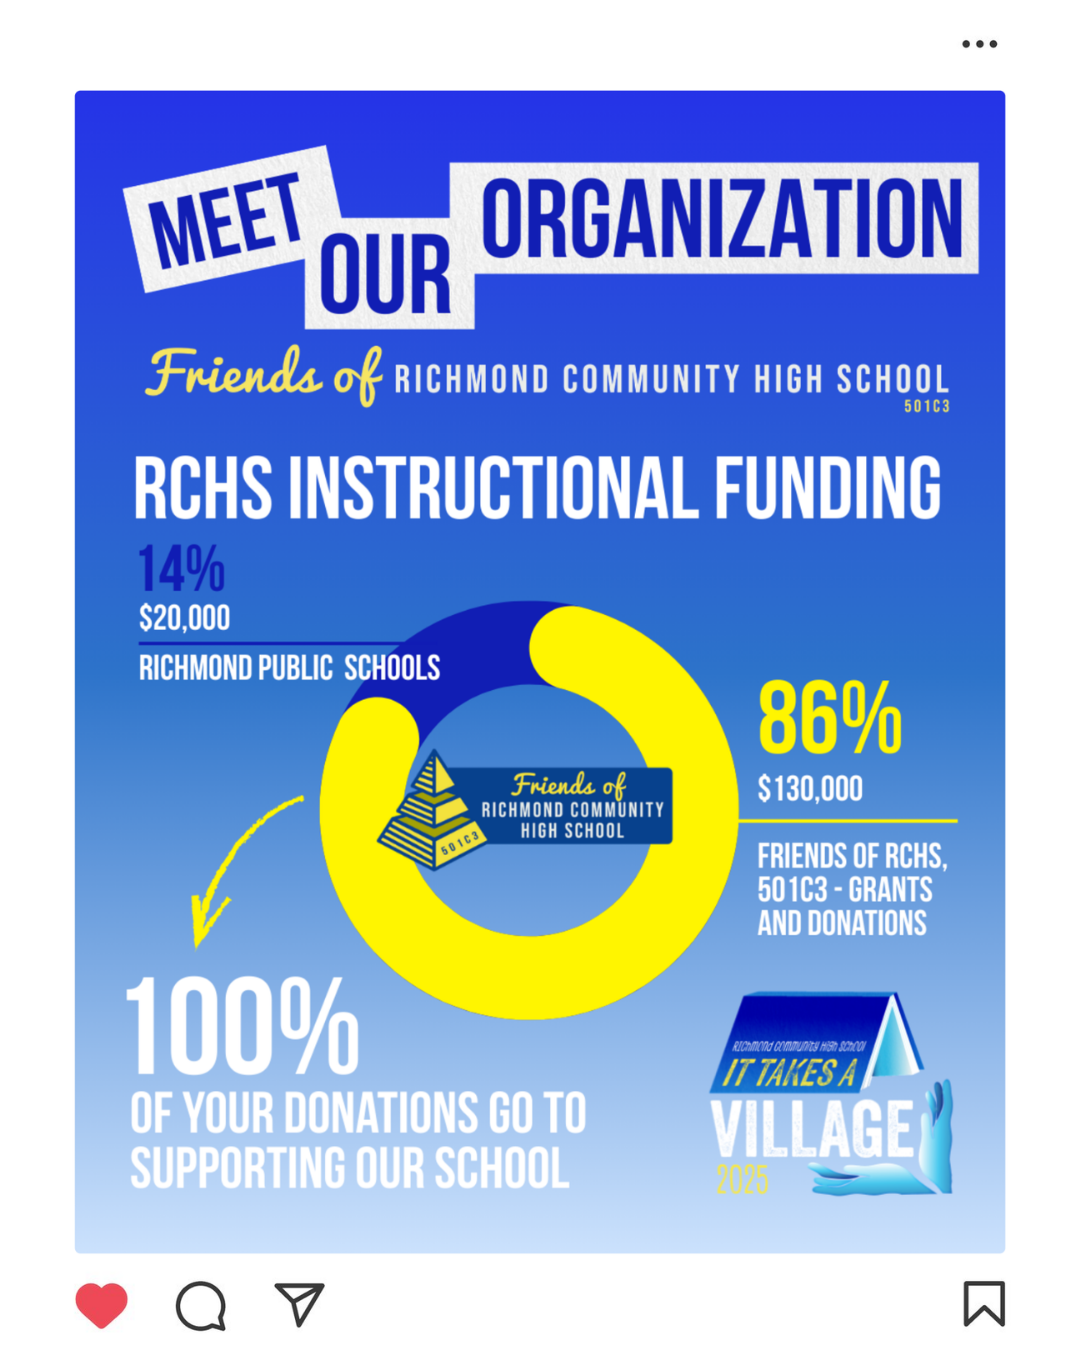
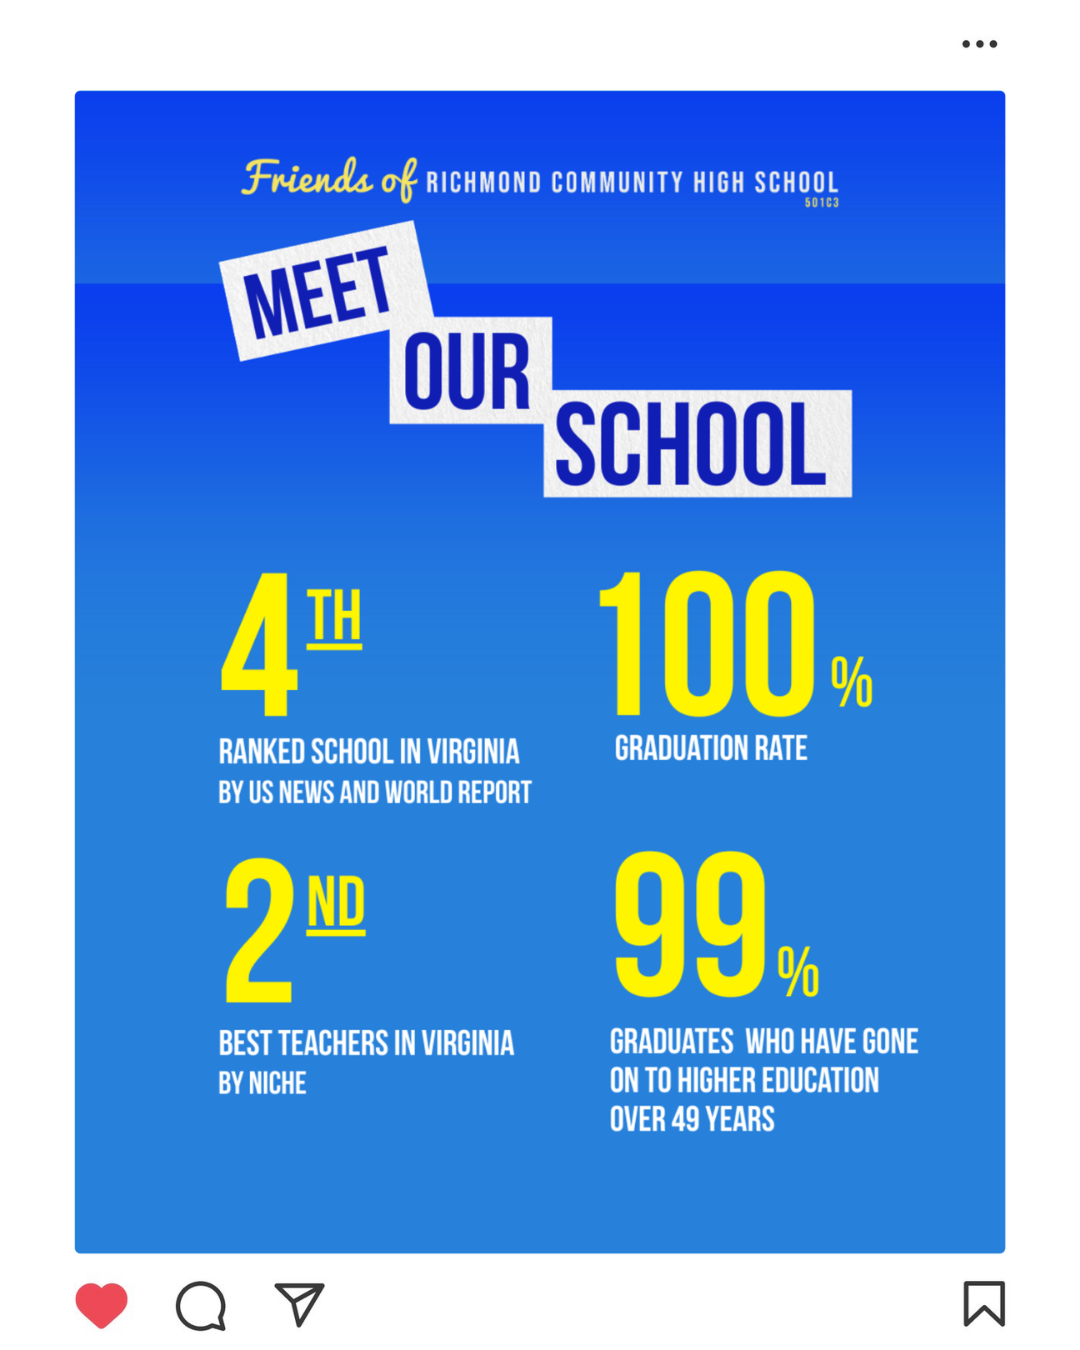
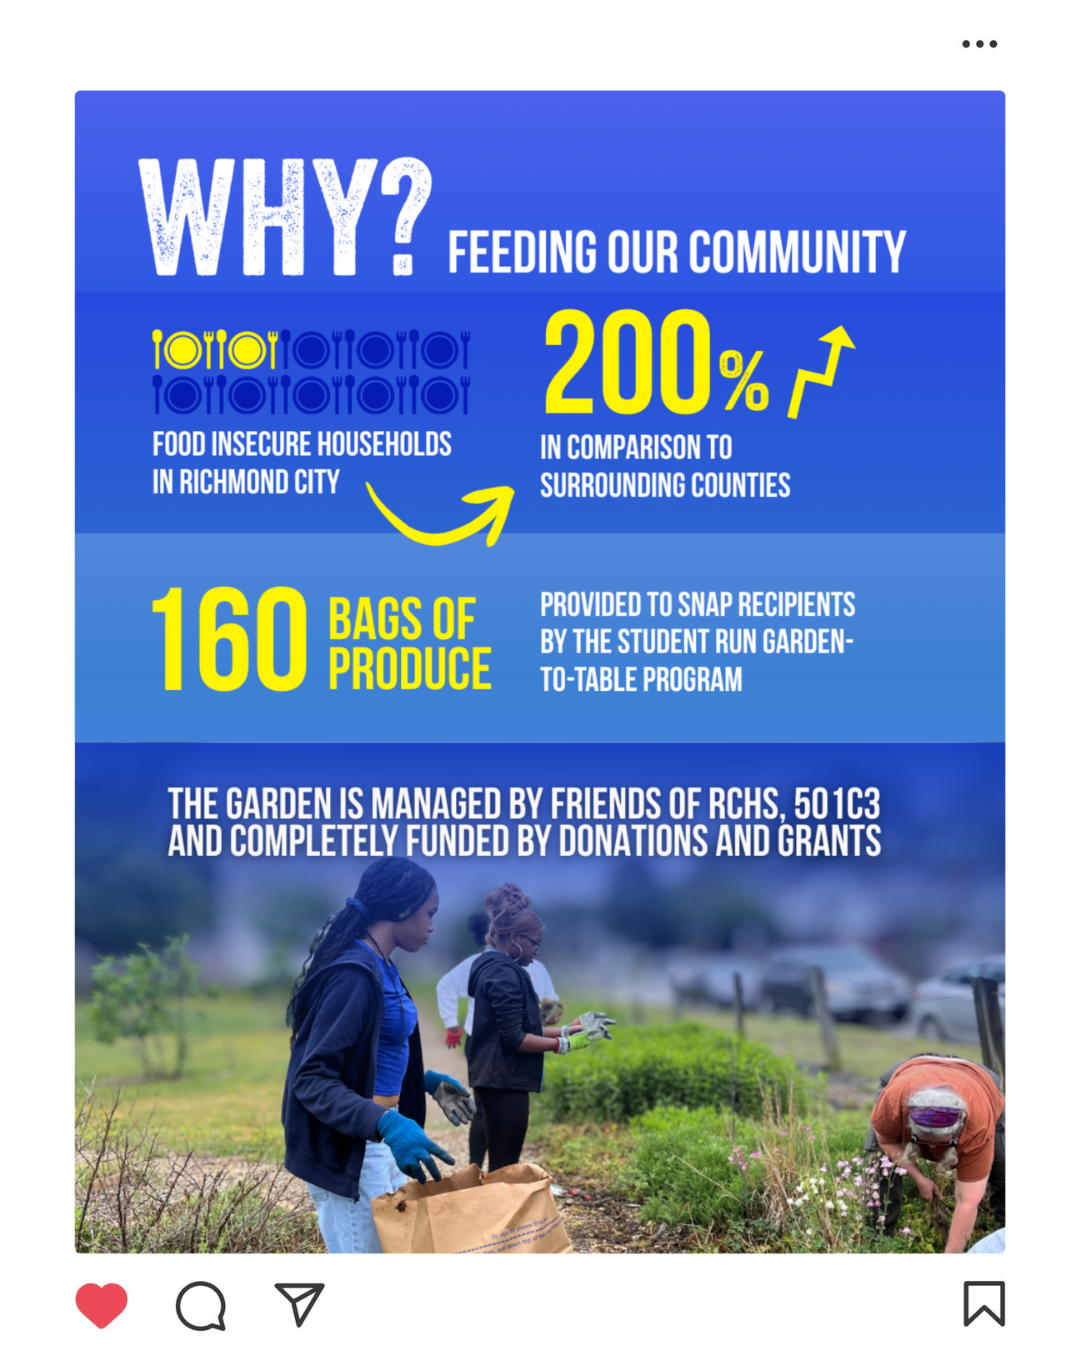
Richmond Community High School 'Meet our Village’ Campaign
Communication through both print and digital means to target high-level donors and general public, generating upwards of $40,000 in donations over a 7-week campaign for Friends of Richmond Community High School 501c3


COMMUNICATION
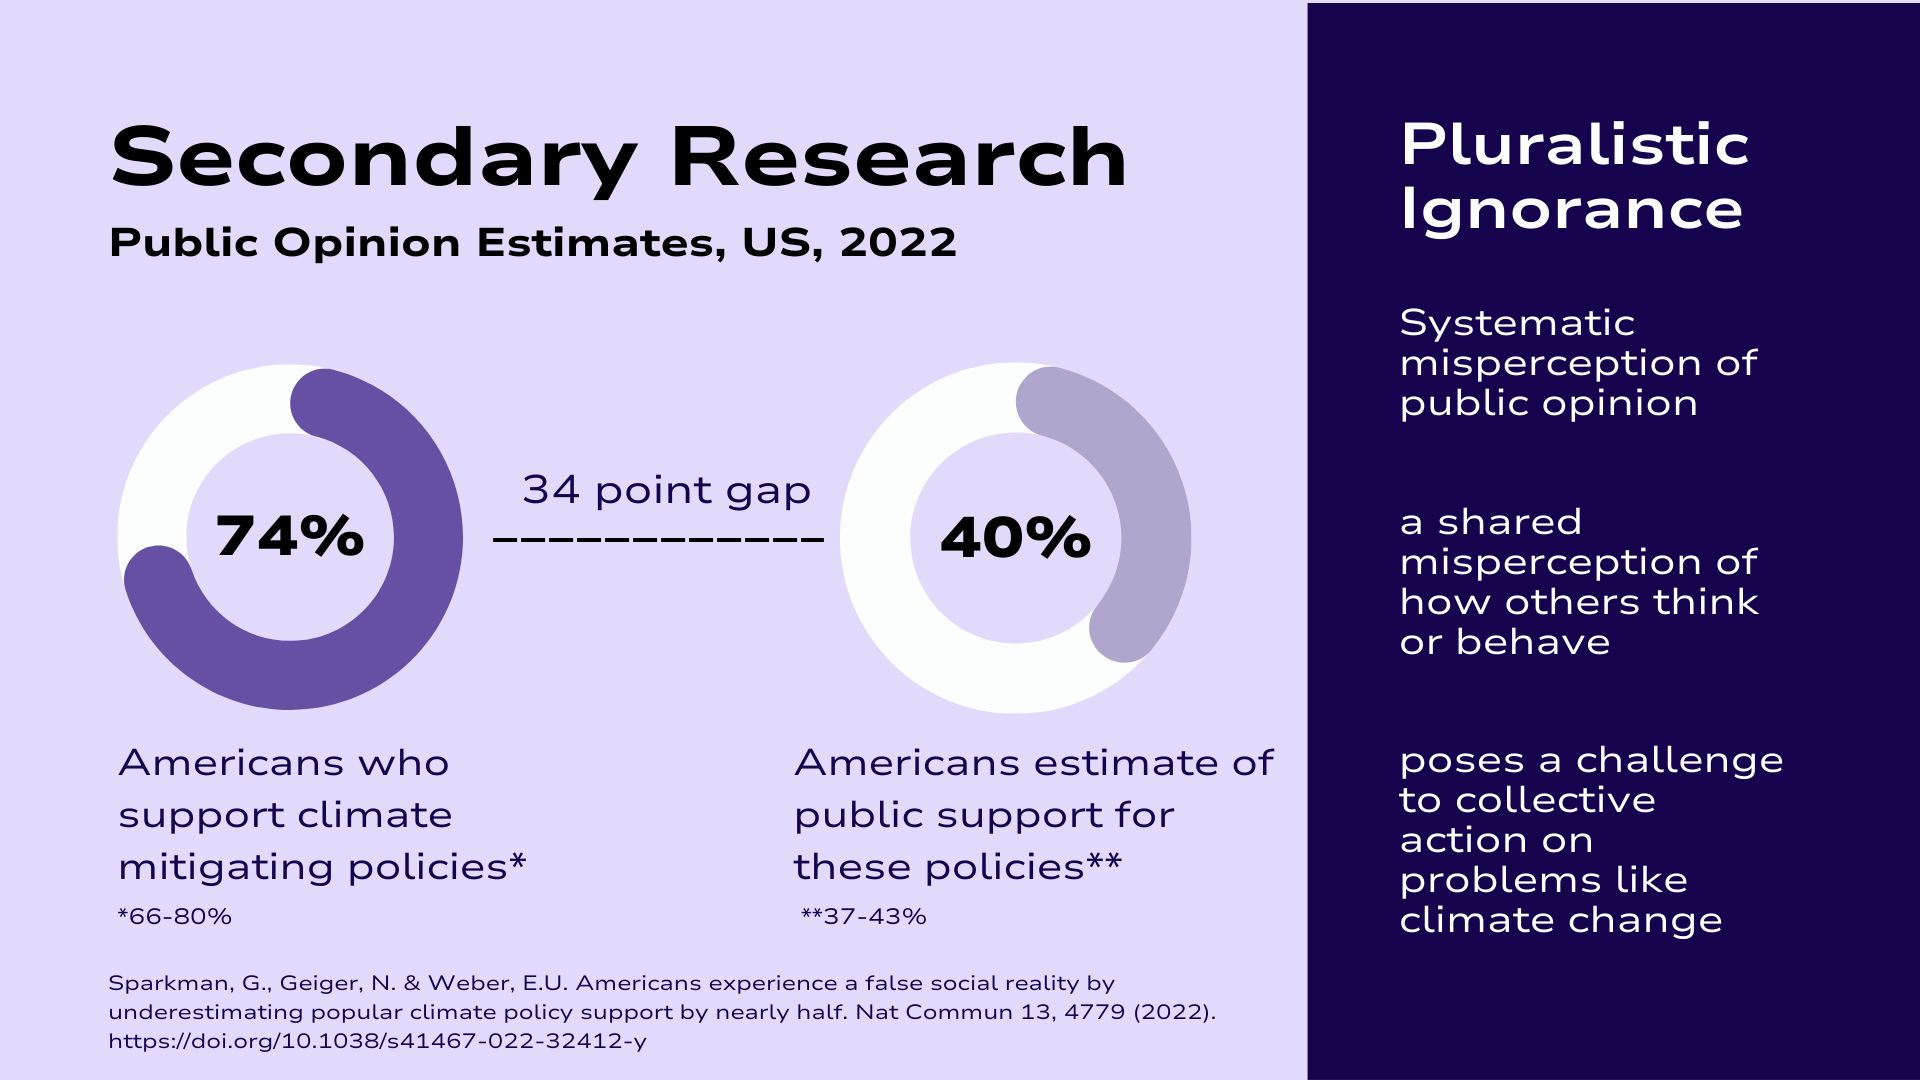
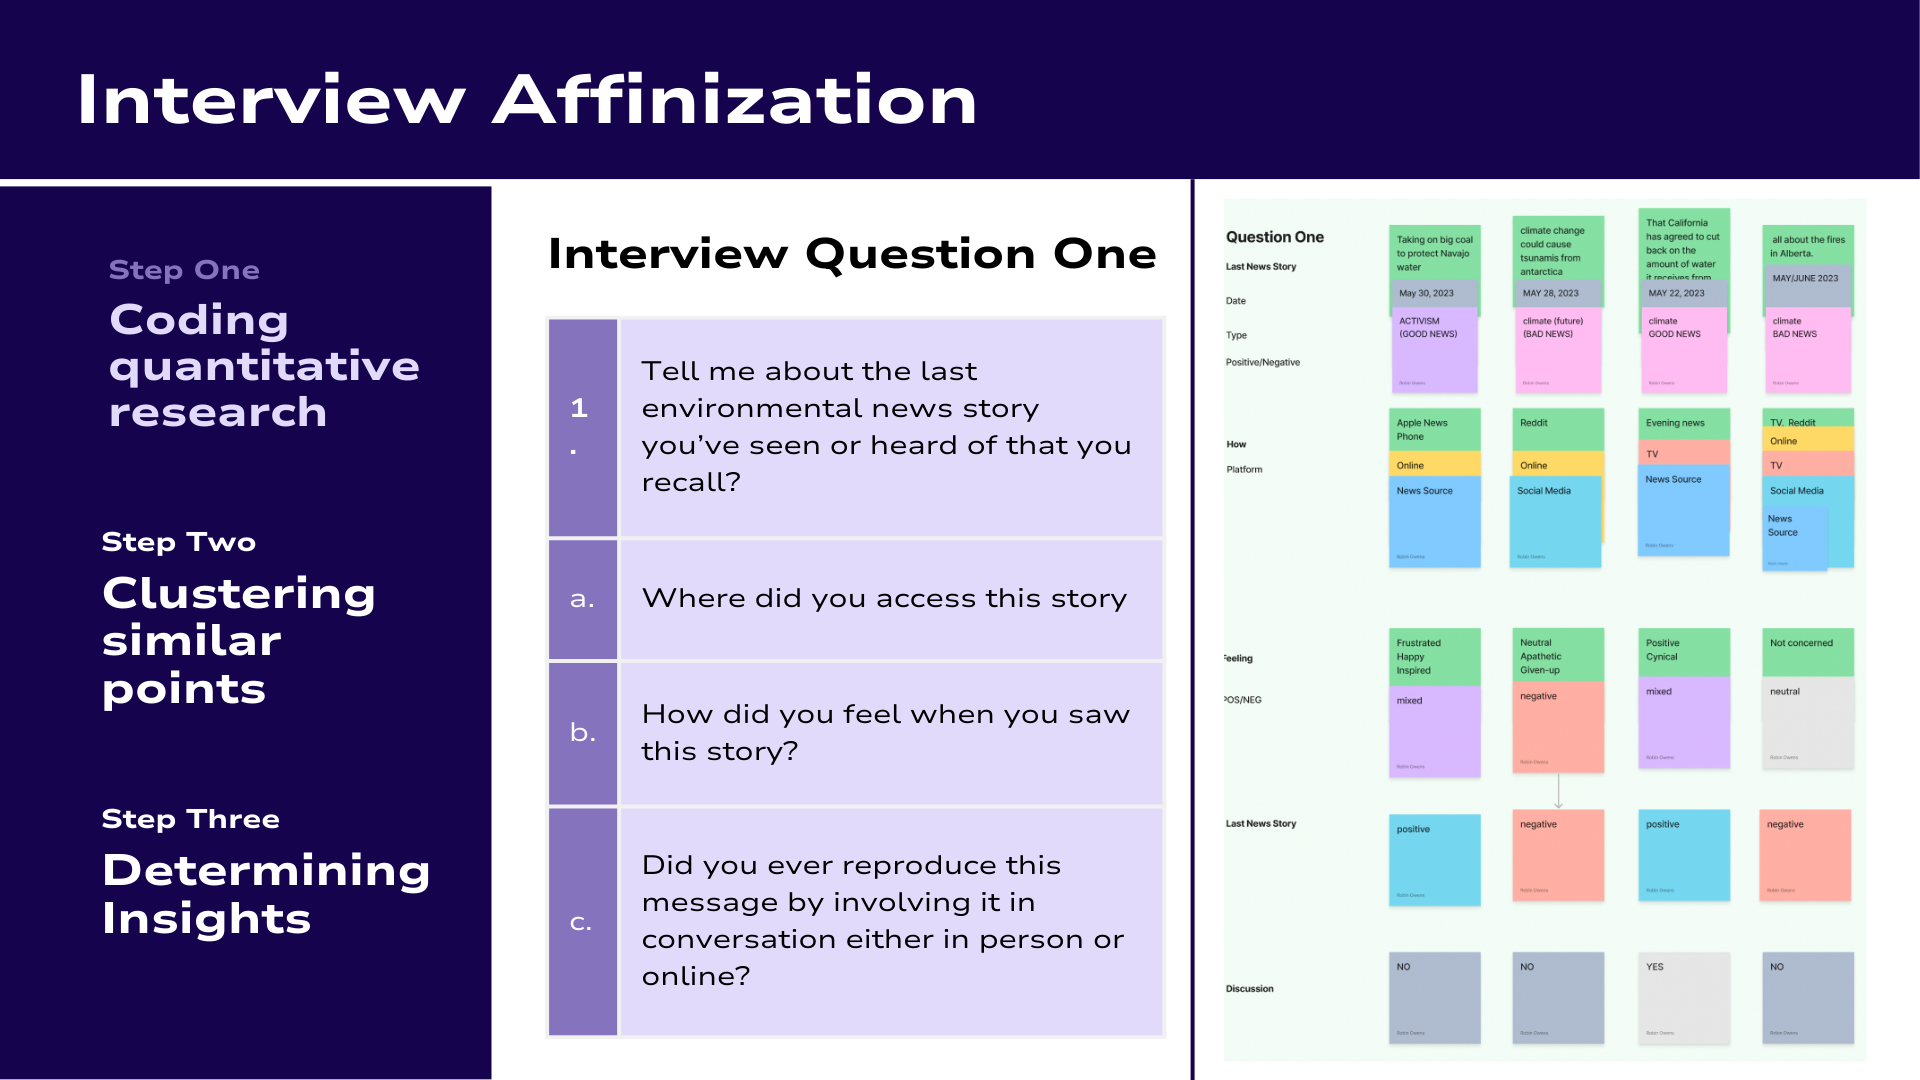
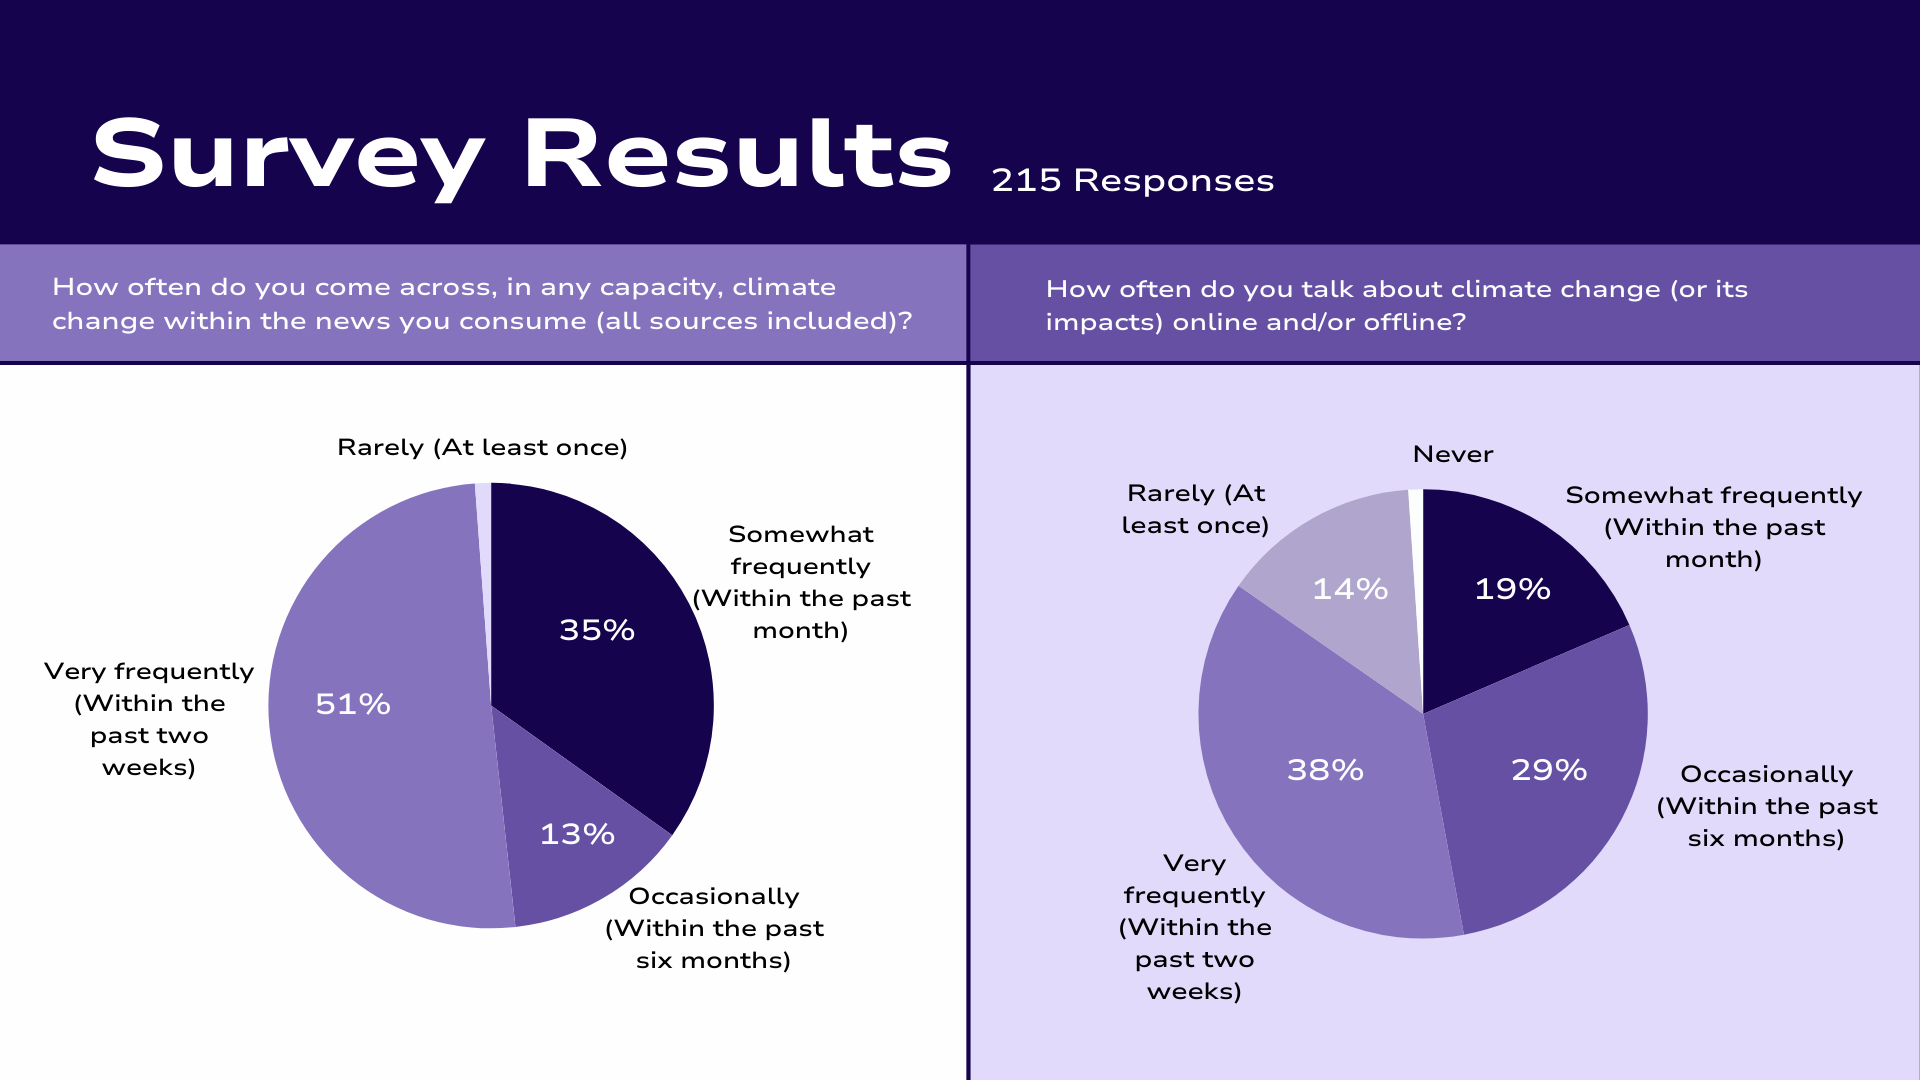
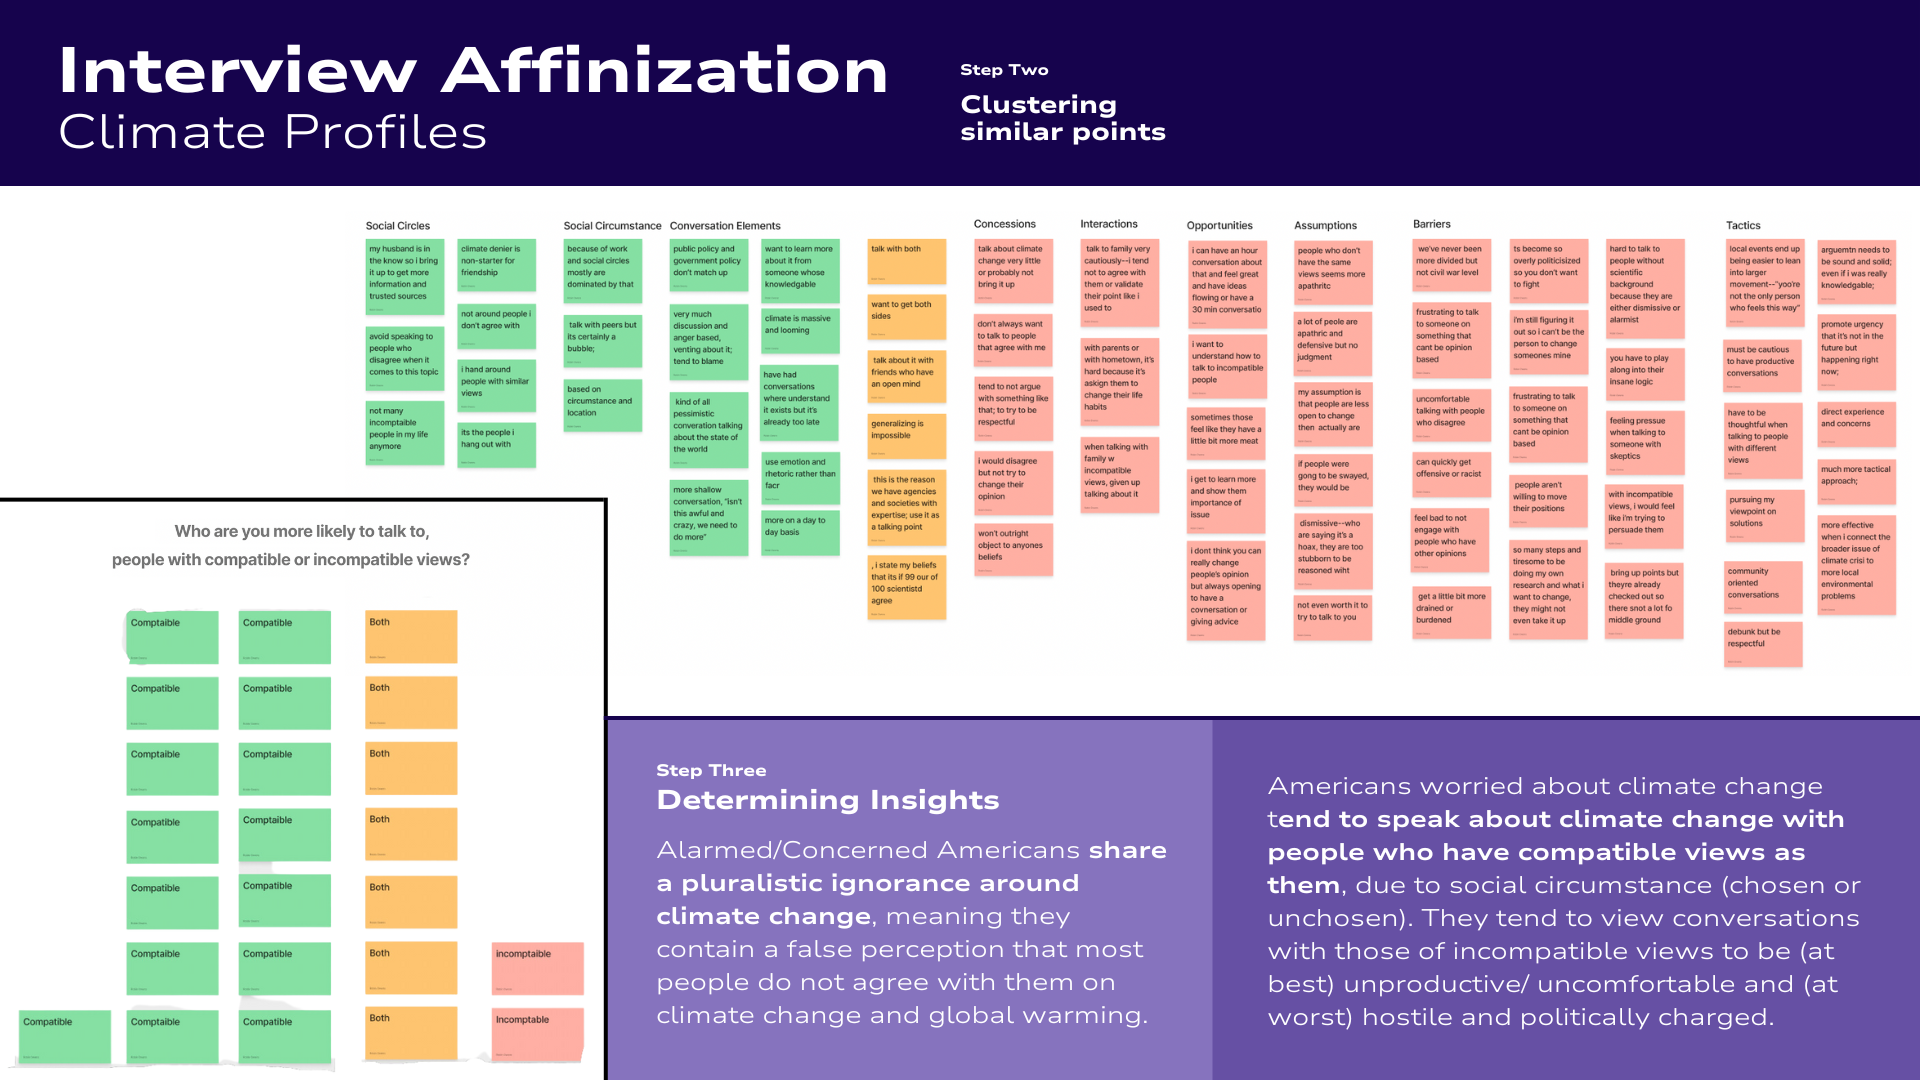
Using data visualization to enhance audience understanding of quantitative research